- Moving the markets
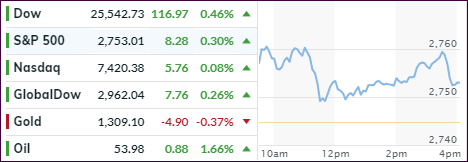
Yesterday’s bullish momentum continued through the early morning when, suddenly, the trend reversed, and equities stumbled lower.
The catalyst for this turnaround came from Marco Rubio, who followed through on yesterday’s threatening tweets that he will soon be filing a bill to change the taxable status of what ZH termed “the only thing that is keeping stocks afloat,” namely corporate buybacks.
ZH then succinctly summed up the rollercoaster day like this:
US equities drifted higher overnight, surged at the cash open, dumped on Marco Rubio’s tweet about taxing buybacks, then ramped back to the highs – because, well… just because…. and then faded as Trump asked Congress for more funding in the border bill…
Still, the bulls remained in charge as the S&P 500 opened and closed above its 200-day M/A for the first time since December. Today’s action confirmed yesterday’s domestic ‘Buy’ signal, so I pulled the trigger and bought some low-volatility ETFs in my advisor practice.
We’ll have to wait and see if upward impetus is maintained before looking for further opportunities in domestic equity ETFs. Our International TTI has now also reached a level that is within striking distance of a new ‘Buy,’ which could very well materialize within the next few days.
Stay tuned…
- ETFs in the Spotlight
In case you missed the announcement and description of this section, you can read it here again.
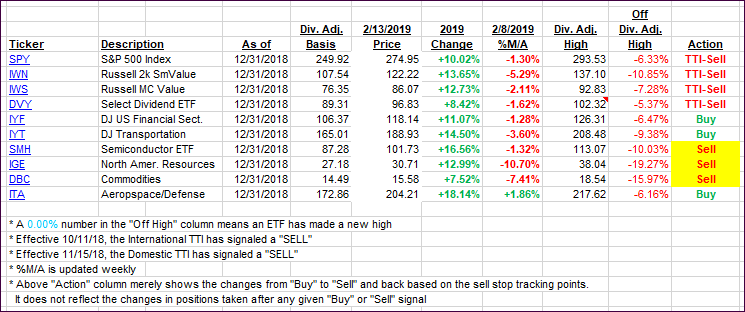
It features 10 broadly diversified and sector ETFs from my HighVolume list as posted every Saturday. Furthermore, they are screened for the lowest MaxDD% number meaning they have been showing better resistance to temporary sell offs than all others over the past year.
The below table simply demonstrates the magnitude with which some of the ETFs are fluctuating regarding their positions above or below their respective individual trend lines (%M/A). A break below, represented by a negative number, shows weakness, while a break above, represented by a positive percentage, shows strength.
For hundreds of ETF choices, be sure to reference Thursday’s StatSheet.
Year to date, here’s how our original candidates from the last cycle have fared:
Again, the %M/A column above shows the position of the various ETFs in relation to their respective long-term trend lines, while the trailing sell stops are being tracked in the “Off High” column. The “Action” column will signal a “Sell” once the -8% point has been taken out in the “Off High” column. For more volatile sector ETFs, the trigger point is -10%.
- Trend Tracking Indexes (TTIs)
Our Trend Tracking Indexes (TTIs) improved with the Domestic one now signaling a new ‘Buy’ subject to the above-mentioned approach.
Here’s how we closed 02/13/2019:
Domestic TTI: +2.07% above its M/A (last close +1.63%)—Buy signal effective 02/13/2019
International TTI: -0.33% below its M/A (last close -0.60%)—Sell signal effective 10/11/2018
Disclosure: I am obliged to inform you that I, as well as my advisory clients, own some of the ETFs listed in the above table. Furthermore, they do not represent a specific investment recommendation for you, they merely show which ETFs from the universe I track are falling.
Contact Ulli


Comments 1
Hey, Ulli
May I suggest that you cast your research net a little wider and see if you can find something worthy of inclusion in your daily report other than the permabear/cynic ZH? Could be worthwhile to see an opinion from a different source from time to time.
Smokey
2/13/19