- Moving the markets
The markets shifted into overdrive supported by nothing more than news of a tentative deal that would keep the government from being shut down for the second time this year. Of course, as we all know, Trump’s border wall funding, or rather lack thereof, had been a stinging point between Republicans and Democrats.
The new but not final arrangement would include 55 miles of border fencing and involve far less money than Trump had demanded. The latest headline said that he was not happy with it, but did not yet reject it, but his approval is needed for this arrangement to go through.
To the computer algos, it did not matter whether there was a deal or not, they simply pumped the indexes higher. Throwing an assist was optimism (not fact) that the trade negotiations between China and the U.S. were progressing positively with more high-level discussions on deck for Thursday.
In the end, the major indexes closed solidly higher with the S&P 500 finally conquering his 200-day M/A and closing slightly above it. Our Domestic Trend Tracking Index (TTI) jumped and closed above its trend line for the 3rd day in a row. The odds of a resumption of the prior bull market have increased, thereby generating a new ‘Buy’ for “broadly diversified domestic equity ETFs.”
Of course, you can never be sure if this the beginning of a race to take out the old highs or simply another head fake. To minimize the effects of the latter, here’s how I approach it in my advisor practice:
- I will watch market activity for a couple of hours tomorrow morning to see if the trend remains steady, or if there is a giant sell-off in the making. If the major indexes are heading back south again, I will wait another day before making a commitment.
- If sentiment is stable, I will look for partial exposure in low-volatility equity ETFs that have shown good performance and a better than average resistance to sell-offs.
If you follow along, you can also use my Thursday StatSheet to select ETFs that meet your risk tolerance. Once this ‘Buy’ signal is underway, I will update the 10 ETFs in the spotlight.
- ETFs in the Spotlight
In case you missed the announcement and description of this section, you can read it here again.
It features 10 broadly diversified and sector ETFs from my HighVolume list as posted every Saturday. Furthermore, they are screened for the lowest MaxDD% number meaning they have been showing better resistance to temporary sell offs than all others over the past year.
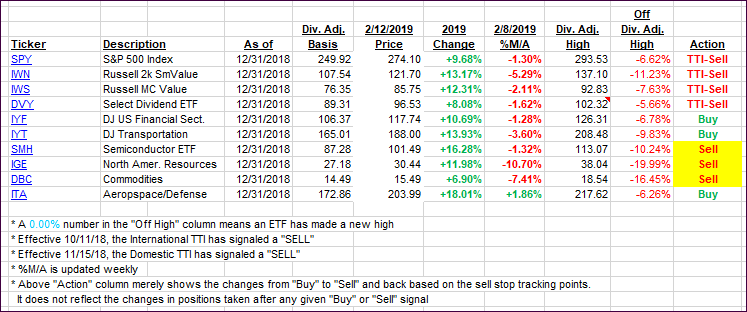
The below table simply demonstrates the magnitude with which some of the ETFs are fluctuating regarding their positions above or below their respective individual trend lines (%M/A). A break below, represented by a negative number, shows weakness, while a break above, represented by a positive percentage, shows strength.
For hundreds of ETF choices, be sure to reference Thursday’s StatSheet.
Year to date, here’s how our original candidates from the last cycle have fared:
Again, the %M/A column above shows the position of the various ETFs in relation to their respective long-term trend lines, while the trailing sell stops are being tracked in the “Off High” column. The “Action” column will signal a “Sell” once the -8% point has been taken out in the “Off High” column. For more volatile sector ETFs, the trigger point is -10%.
- Trend Tracking Indexes (TTIs)
Our Trend Tracking Indexes (TTIs) improved with the Domestic one now signaling a new ‘Buy’ subject to the above-mentioned approach.
Here’s how we closed 02/12/2019:
Domestic TTI: +1.63% above its M/A (last close +0.39%)—Buy signal effective 02/13/2019
International TTI: -0.60% below its M/A (last close -1.62%)—Sell signal effective 10/11/2018
Disclosure: I am obliged to inform you that I, as well as my advisory clients, own some of the ETFs listed in the above table. Furthermore, they do not represent a specific investment recommendation for you, they merely show which ETFs from the universe I track are falling.
Contact Ulli

