- Moving the markets
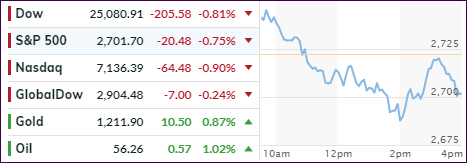
For a while it looked like the opening bounce had some starch in it, but that hope dissipated in the hurry, when a mid-day dive gave the bears the upper hand and south went with the Dow being down -250 points at one time.
A late afternoon levitation gave the bulls some hope that we might conquer the various unchanged lines again, when suddenly the sell-off resumed, and the major indexes dove into the close but off their lows for the session.
A host of worries occupied Wall Street traders. The latest Brexit developments appear to have a live of their own and are not giving anybody the warm fuzzies. Powerhouse Germany, the economic engine of Europe, started to sputter by seeing its own economy contracting -0.2% in Q3, its worst GDP print in 3 years, as car production collapsed.
China’s numbers are showing a mixed picture with retail sales slowing but industrial output and investment ticking higher. Domestically, consumer prices rose as expected, even though the increase of 0.3% was the fastest rate since the start of 2018. The good thing is that gasoline contributed to much of that, so we can expect that to reverse in view of collapsing oil prices.
With the markets, and our Trend Tracking Indexes (TTIs) as well, having wavered in and out of bullish territory, one trader summed up the current environment perfectly by noting that “we’re now in a deer in the headlights environment,” as every move looks to be tentative and unconvincing.
In the end, today’s move pushed our Domestic TTI to -2.18%. Despite having been patient only partially invested in a low volatility ETF, we have now reached a point below the trend line that warrants a move out of the market and onto the sidelines. Unless, a bullish move is happening tomorrow, I declare this domestic “Buy” signal to be over effective 11/15/18.
However, in this current market environment nothing surprises me. It could very well be possible for the markets to turn around again and generate a new “Buy,” which would let us participate in the much-anticipated year-end rally, in case it materializes.
- ETFs in the Spotlight
In case you missed the announcement and description of this section, you can read it here again.
It features 10 broadly diversified and sector ETFs from my HighVolume list as posted every Saturday. Furthermore, they are screened for the lowest MaxDD% number meaning they have been showing better resistance to temporary sell offs than all others over the past year.
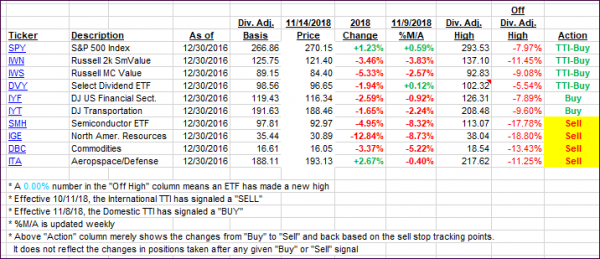
The below table simply demonstrates the magnitude with which some of the ETFs are fluctuating regarding their positions above or below their respective individual trend lines (%M/A). A break below, represented by a negative number, shows weakness, while a break above, represented by a positive percentage, shows strength.
For hundreds of ETF choices, be sure to reference Thursday’s StatSheet.
Year to date, here’s how our candidates have fared so far:
Again, the %M/A column above shows the position of the various ETFs in relation to their respective long-term trend lines, while the trailing sell stops are being tracked in the “Off High” column. The “Action” column will signal a “Sell” once the -8% point has been taken out in the “Off High” column. For more volatile sector ETFs, the trigger point is -10%.
- Trend Tracking Indexes (TTIs)
Our Trend Tracking Indexes (TTIs) headed south with the Domestic one generating a “Sell” signal effective tomorrow, as described in the comment section above.
Here’s how we closed 11/14/2018:
Domestic TTI: -2.18% below its M/A (last close -1.56%)—Buy signal effective 11/08/2018
International TTI: -4.72% below its M/A (last close -4.44%)—Sell signal effective 10/11/2018
Disclosure: I am obliged to inform you that I, as well as my advisory clients, own some of the ETFs listed in the above table. Furthermore, they do not represent a specific investment recommendation for you, they merely show which ETFs from the universe I track are falling within the guidelines specified.
Contact Ulli

