- Moving the markets
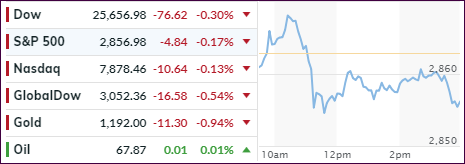
An early rally fizzled out mid-day with the major indexes suddenly tanking and closing modestly in the red. Today’s session had the feel of a typical summer day with volume disappearing causing the S&P sectors to trade lower and directionless.
However, the object in focus that may impact markets tomorrow is the annual meeting of the bankers in Jackson Hole, WY where Fed head Powell will be the most watched and analyzed speaker.
I don’t think any more earthshaking news will be forthcoming other than what yesterday’s minutes from the last meeting revealed. But, the anxious crowd hopes for more clarity. Hmm, the details I outlined yesterday couldn’t be any clearer…
On the economic data front, 2 more bad reports surfaced. New home sales took a hit by falling to a 9-month low, while manufacturing tumbled, missed expectations and dropped for the 3rd month in a row.
ZH featured some worthwhile charts that show some of the current decoupling of a variety of important indexes.
- Chinese Yuan and US stocks
- Bonds and US Stocks
- Yield Curve and US Stocks
- Commodities and US Stocks
- World Stocks and US Stocks
- Macro and US Stocks
- Global Central Bank Balance Sheets and US Stocks
So, what do these charts mean? They simply show that things are out of sync and eventually will adjust themselves and recouple. As always, no one has the answer as to which direction the adjustment will play out; we simply must be patient and observe the developments and see if any of them will affect our Trend Tracking Indexes (TTIs).
- ETFs in the Spotlight
In case you missed the announcement and description of this section, you can read it here again.
It features 10 broadly diversified and sector ETFs from my HighVolume list as posted every Saturday. Furthermore, they are screened for the lowest MaxDD% number meaning they have been showing better resistance to temporary sell offs than all others over the past year.
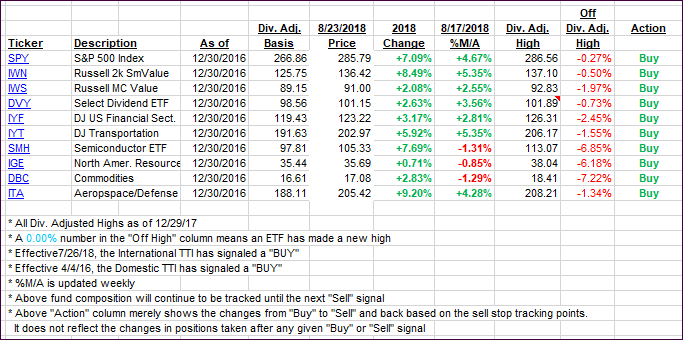
The below table simply demonstrates the magnitude with which some of the ETFs are fluctuating regarding their positions above or below their respective individual trend lines (%M/A). A break below, represented by a negative number, shows weakness, while a break above, represented by a positive percentage, shows strength.
For hundreds of ETF choices, be sure to reference Thursday’s StatSheet.
Year to date, here’s how our candidates have fared so far:
Again, the %M/A column above shows the position of the various ETFs in relation to their respective long-term trend lines, while the trailing sell stops are being tracked in the “Off High” column. The “Action” column will signal a “Sell” once the -8% point has been taken out in the “Off High” column. For more volatile sector ETFs, the trigger point is -10%.
- Trend Tracking Indexes (TTIs)
Our Trend Tracking Indexes (TTIs) pulled back a tad as the markets were directionless.
Here’s how we closed 08/23/2018:
Domestic TTI: +2.84% above its M/A (last close +2.89%)—Buy signal effective 4/4/2016
International TTI: -0.57% below its M/A (last close -0.24%)—Buy signal effective 7/26/2018
Disclosure: I am obliged to inform you that I, as well as my advisory clients, own some of the ETFs listed in the above table. Furthermore, they do not represent a specific investment recommendation for you, they merely show which ETFs from the universe I track are falling within the guidelines specified.
Contact Ulli

