- Moving the markets
The rally gathered steam and continued for the fourth straight day despite some weakness setting in towards the end of the session. I guess it was a case of the nerves not only due the S&P 500 notching an intra-day record but also gaining on the day when stocks tied the record for longest bull market in history, according to MarketWatch. The Russell 2000 and the Dow transports set records as well.
Despite Trump’s rhetoric to the contrary, optimism still prevails that the US/China trade dispute will be resolved amicably, which has been a supporting factor for equities along with solid corporate earnings.
With earnings season just about being over, a new focal point is needed to provide the ammo for further market advances. With no essential economic data on deck, that focus has been on the Fed, which will release the minutes from their latest meeting tomorrow around lunchtime.
This is followed by a speech from Fed head Powell on Friday, where much hope is put on clarification of some of the potential market headwinds, such as impact of current trade policy, plans for further rate hikes, and the effect of the Turkish currency crises on other emerging markets.
As I am writing this, Trump’s personal lawyer Michael Cohen pleaded guilty to a variety of charges. The futures markets were modestly affected with the major indexes currently giving back some of today’s gains. I don’t think this will be much of a market moving affair, but you can never be sure until we see how this plays out tomorrow.
- ETFs in the Spotlight
In case you missed the announcement and description of this section, you can read it here again.
It features 10 broadly diversified and sector ETFs from my HighVolume list as posted every Saturday. Furthermore, they are screened for the lowest MaxDD% number meaning they have been showing better resistance to temporary sell offs than all others over the past year.
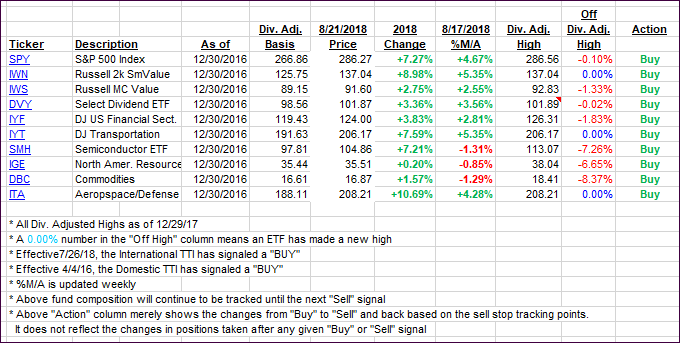
The below table simply demonstrates the magnitude with which some of the ETFs are fluctuating regarding their positions above or below their respective individual trend lines (%M/A). A break below, represented by a negative number, shows weakness, while a break above, represented by a positive percentage, shows strength.
For hundreds of ETF choices, be sure to reference Thursday’s StatSheet.
Year to date, here’s how our candidates have fared so far:
Again, the %M/A column above shows the position of the various ETFs in relation to their respective long-term trend lines, while the trailing sell stops are being tracked in the “Off High” column. The “Action” column will signal a “Sell” once the -8% point has been taken out in the “Off High” column. For more volatile sector ETFs, the trigger point is -10%.
- Trend Tracking Indexes (TTIs)
Our Trend Tracking Indexes (TTIs) both advanced as the rally gathered steam for the 4th straight day.
Here’s how we closed 08/21/2018:
Domestic TTI: +2.81% above its M/A (last close +2.66%)—Buy signal effective 4/4/2016
International TTI: -0.44% below its M/A (last close -0.84%)—Buy signal effective 7/26/2018
Disclosure: I am obliged to inform you that I, as well as my advisory clients, own some of the ETFs listed in the above table. Furthermore, they do not represent a specific investment recommendation for you, they merely show which ETFs from the universe I track are falling within the guidelines specified.
Contact Ulli

