- Moving the markets
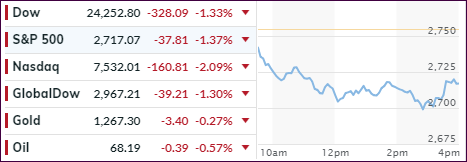
The trade war rhetoric continued unabated with the Chinese President now vowing that “no more turning the other cheek” was the new mantra. Equity markets finally got the hint that many things could change for the worse when it comes to global trading, and that there may be more losers than winners, contrary to early expectations.
The major indexes took a dive right after the opening bell and headed south for the entire session threatening to take a dive into the close. To limit the damage, Trump’s trade advisor emerged to utter some soothing words by saying “that there were no plans to impose investment restrictions,” contrary to Mnuchin’s view, “and that today’s slide is an overreaction.”
This halted downward momentum, and we saw a rebound during the last hour, with the Dow recovering some 100 points, to limit the damage. However, it did break below its 200-day M/A for the first time in 2 years. Looking at the bigger picture, the S&P 500 is still positioned slightly above of where we started the month and is remaining above its own 200-day M/A by +2.02%.
To sum it up, there was no place to hide. The tech sector got hammered, the US Dollar headed south, FANG stocks were freefalling, Europe gave back Friday’s gains, and the overall mood was simply, well, sour.
We’ll have to wait and see, if this down day was just an outlier or the beginning of more downside action. Recent activity seems to point to the latter, but you can’t be sure until it happens.
The immediate effect of today’s downward swing was reflected in the International TTI, which last week had already broken slightly below its trend line but bounced back to keep the bullish theme intact.
The break today was a sharp one with the International TTI ending up -1.36% below its trend line, which is a clear and decisive move. Again, I will play it the same way as last week.
If I see a sharp rebound tomorrow, I will hold off with taking any action. However, if there is continued weakness, I will take that as new “Sell” signal for “broadly diversified international ETFs” and liquidate the affected positions. Stay tuned!
- ETFs in the Spotlight
In case you missed the announcement and description of this section, you can read it here again.
It features 10 broadly diversified and sector ETFs from my HighVolume list as posted every Saturday. Furthermore, they are screened for the lowest MaxDD% number meaning they have been showing better resistance to temporary sell offs than all others over the past year.
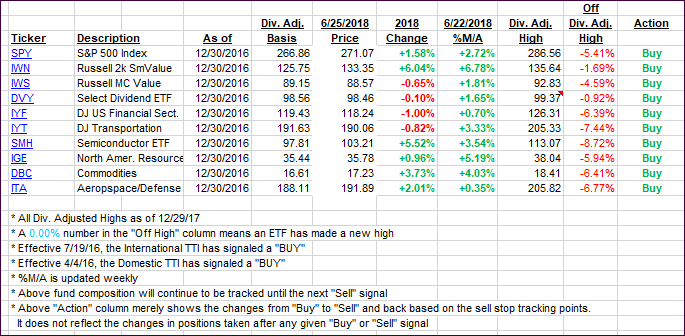
The below table simply demonstrates the magnitude with which some of the ETFs are fluctuating regarding their positions above or below their respective individual trend lines (%M/A). A break below, represented by a negative number, shows weakness, while a break above, represented by a positive percentage, shows strength.
For hundreds of ETF choices, be sure to reference Thursday’s StatSheet.
Year to date, here’s how our candidates have fared so far:
Again, the %M/A column above shows the position of the various ETFs in relation to their respective long-term trend lines, while the trailing sell stops are being tracked in the “Off High” column. The “Action” column will signal a “Sell” once the -7.5% point has been taken out in the “Off High” column.
- Trend Tracking Indexes (TTIs)
Our Trend Tracking Indexes (TTIs) headed south with the International one breaking clearly into bear market territory. I will consider that a new “Sell” signal and act on it as described above.
Here’s how we closed 06/25/2018:
Domestic TTI: +1.53% above its M/A (last close +2.28%)—Buy signal effective 4/4/2016
International TTI: -1.36% below its M/A (last close +0.15%)—Buy signal effective 7/19/2016
Disclosure: I am obliged to inform you that I, as well as my advisory clients, own some of the ETFs listed in the above table. Furthermore, they do not represent a specific investment recommendation for you, they merely show which ETFs from the universe I track are falling within the guidelines specified.
Contact Ulli

