ETF Tracker StatSheet
https://theetfbully.com/2018/03/weekly-statsheet-etf-tracker-newsletter-updated-03-08-2018/
A ONE WAY STREET FOR THE BULLS
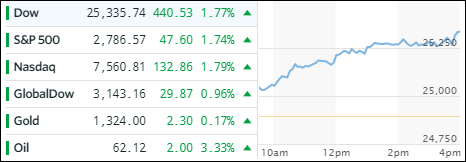
[Chart courtesy of MarketWatch.com]- Moving the markets
Forget the concerns of the past week. Things like tariffs, trade wars, rising bond yields and Gary Cohn’s exit from the White House appear to be in the rear view mirror, as the non-farm payroll report took front and center, which ZH summarized as follows:
While the headline payroll print of 313K was impressive, a look under the cover reveals even stronger data: first, the Household Survey showed that a whopping 785K jobs were added in February, while the number of unemployed Americans rose by only 22K, and with the labor force rising by 806K, this explains why the unemployment rate remained unchanged at 4.1%.
But what is even more notable is that when looking at the breakdown of job additions, one finds that in February, a near record 729K full-time jobs were added, the biggest monthly increase since last September’s 794K…
The bulls licked their chops and upward momentum went into overdrive despite the fly in the ointment being a total lack of wage growth, but hey, who cares about such trivia as the major indexes rallied without a pause with the Dow reclaiming its 25k level. The Wall Street mood was upbeat and remained that way despite the 10-year bond yield adding 4 basis points to end the week at 2.90%.
Notwithstanding the ups and downs all week, the US Dollar managed to close unchanged over the past 5 trading sessions. Looking towards next week, I am curious to see if this rally has legs and can lead us towards taking out the old highs.
- ETFs in the Spotlight
In case you missed the announcement and description of this section, you can read it here again.
It features 10 broadly diversified and sector ETFs from my HighVolume list as posted every Saturday. Furthermore, they are screened for the lowest MaxDD% number meaning they have been showing better resistance to temporary sell offs than all others over the past year.
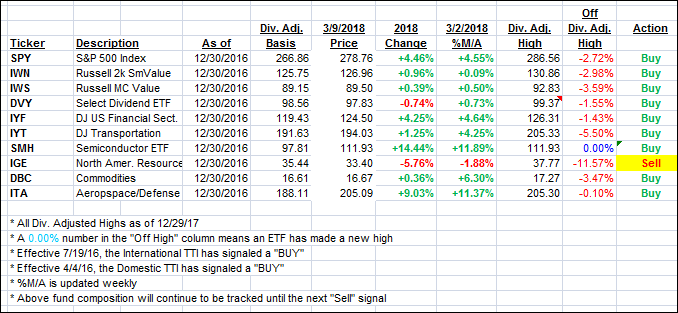
The below table simply demonstrates the magnitude with which some of the ETFs are fluctuating in regards to their positions above or below their respective individual trend lines (%M/A). A break below, represented by a negative number, shows weakness, while a break above, represented by a positive percentage, shows strength.
For hundreds of ETF choices, be sure to reference Thursday’s StatSheet.
Year to date, here’s how our candidates have fared so far:
Again, the %M/A column above shows the position of the various ETFs in relation to their respective long term trend lines, while the trailing sell stops are being tracked in the “Off High” column. The “Action” column will signal a “Sell” once the -7.5% point has been taken out in the “Off High” column.
- Trend Tracking Indexes (TTIs)
Our Trend Tracking Indexes (TTIs) jumped as the bulls closed out this week in their favor.
Here’s how we closed 3/09/2018:
Domestic TTI: +3.98% above its M/A (last close +3.46%)—Buy signal effective 4/4/2016
International TTI: +4.06% above its M/A (last close +3.32%)—Buy signal effective 7/19/2016
Disclosure: I am obliged to inform you that I, as well as my advisory clients, own some of the ETFs listed in the above table. Furthermore, they do not represent a specific investment recommendation for you, they merely show which ETFs from the universe I track are falling within the guidelines specified.
Contact Ulli


Comments 2
What is ZH?
It’s http://www.zerohedge.com