ETF Tracker StatSheet
https://theetfbully.com/2017/05/weekly-statsheet-etf-tracker-newsletter-updated-05042017/
TUG OF WAR: STRONG JOBS REPORT VS. FRENCH ELECTIONS
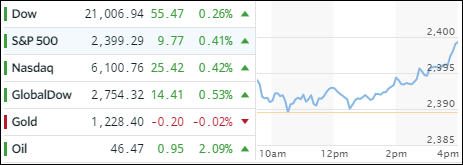
[Chart courtesy of MarketWatch.com]- Moving the Markets
It was a tug of war as a strong jobs report battled for market direction against the uncertainty of the second and final round of the upcoming French elections. For the day, the on the surface positives of the jobs report were the winner as equities picked up some stream and closed higher with the S&P 500 knocking on the 2,400 milestone marker.
The jobs report showed that April payrolls jumped by 211,000 beating expectations and providing some relief after March’s disappointing revised 79,000 number. The disappointing part was that, despite strong jobs growth, hourly earnings were soft rising only 2.5% YoY vs. an expected 2.7%. So, why is it that in a labor market with alleged full employment wages simply can’t rise? The answer is clear and has to do with the quality of jobs, as most of them once again were in low or minimum-wage sectors aka waiters and bartenders.
ZH summed up today’s session as follows:
Massive liquidity issues in China wealth product liquidation, commodities crashing, oil plunging, US macro data disappointments, US earnings disappointments, and Buffett dumping Big Blue – only makes sense that The Dow just had its quietest 8 days since 1952!
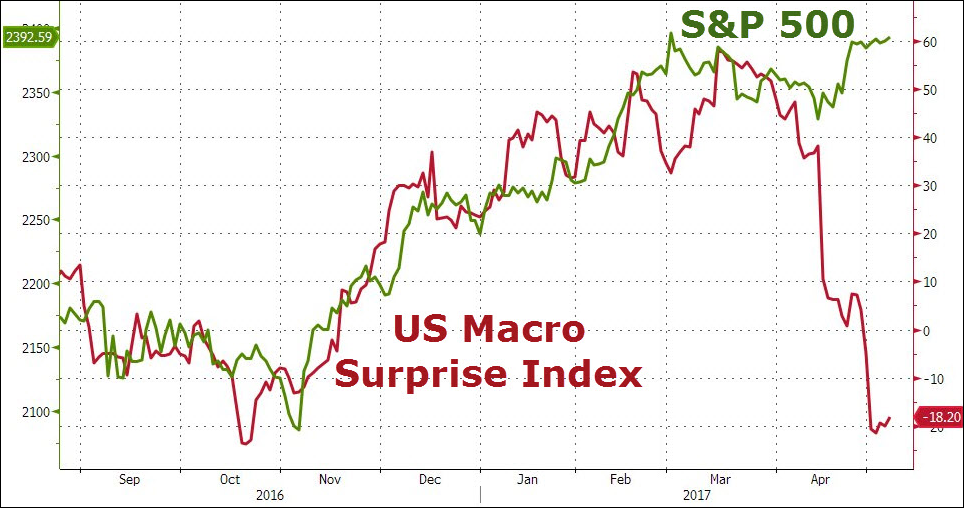
US Macro data has negatively surprised for 7 straight weeks – dropping to its weakest since October…
Shown in a graph, it looks like this:
Source: ZeroHedge
Makes you wonder how long this divergence can continue.
- ETFs in the Spotlight (updated for 2017)
In case you missed the announcement and description of this section, you can read it here again.
It features 10 broadly diversified and sector ETFs from my HighVolume list as posted every Saturday. Furthermore, they are screened for the lowest MaxDD% number meaning they have been showing better resistance to temporary sell offs than all others over the past year.
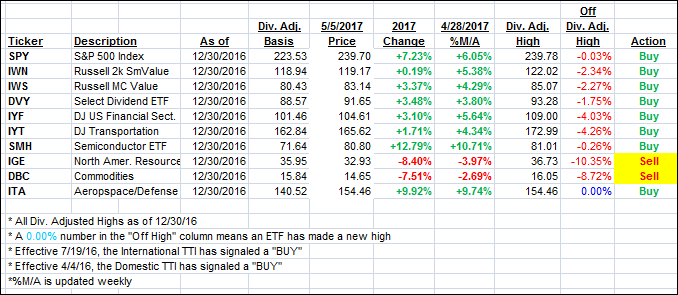
The below table simply demonstrates the magnitude with which some of the ETFs are fluctuating in regards to their positions above or below their respective individual trend lines (%M/A). A break below, represented by a negative number, shows weakness, while a break above, represented by a positive percentage, shows strength.
For hundreds of ETF choices, be sure to reference Thursday’s StatSheet.
Year to date, here’s how the 2017 candidates have fared so far:
Again, the %M/A column above shows the position of the various ETFs in relation to their respective long term trend lines, while the trailing sell stops are being tracked in the “Off High” column. The “Action” column will signal a “Sell” once the -7.5% point has been taken out in the “Off High” column.
- Trend Tracking Indexes (TTIs)
Our Trend Tracking Indexes (TTIs) gained as the major indexes rallied during the second half of the session.
Here’s how we closed 5/5/2017:
Domestic TTI: +3.46% (last close +3.41%)—Buy signal effective 4/4/2016
International TTI: +8.40% (last close +8.23%)—Buy signal effective 7/19/2016
Disclosure: I am obliged to inform you that I, as well as my advisory clients, own some of the ETFs listed in the above table. Furthermore, they do not represent a specific investment recommendation for you, they merely show which ETFs from the universe I track are falling within the guidelines specified.
————————————————————-
READER Q & A FOR THE WEEK
All Reader Q & A’s are listed at our web site!
Check it out at:
https://theetfbully.com/questions-answers/
———————————————————-
WOULD YOU LIKE TO HAVE YOUR INVESTMENTS PROFESSIONALLY MANAGED?
Do you have the time to follow our investment plans yourself? If you are a busy professional who would like to have his portfolio managed using our methodology, please contact me directly or get more details at:
https://theetfbully.com/personal-investment-management/
———————————————————
Back issues of the ETF/No Load Fund Tracker are available on the web at:
https://theetfbully.com/newsletter-archives/
Contact Ulli


