ETF Tracker StatSheet
Market Commentary
Wall Street Takes A Breather
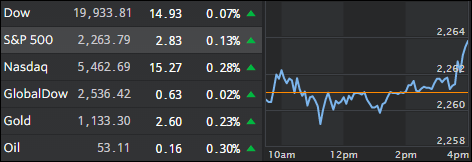
[Chart courtesy of MarketWatch.com]- Moving the Markets
The major indexes moved in a tight trading range today and for most of the week with the S&P 500 adding 6 points over the past 5 trading sessions.
I found today’s two economic data points more confusing than clarifying:
There is an odd divergence in the latest UMichigan consumer sentiment print: on one hand, the December index of Consumer Sentiment rose from 93.8 in November to 98.2, up from the preliminary 98.0 print, even as long-term inflation expectation, those in the 5-10 year bucket, dropped from 2.50% to 2.30%,a new all time low print.
hich is odd, because the very reason for the surge in confidence is due to the recent spike in the market, driven higher by expectations or rising inflation, something which apparently has not filtered through to ordinary US consumers, who instead are hoping to have their Dow Jones 20,000 hat, while basking in the glow of dropping prices and a “deflationary mindset.”
And then this:
Soaring homebuilder confidence, crashing mortgage applications, spiking mortgage rates, weak pending home sales, strong existing home sales, and now new home sales for November surged 5.2% MoM (smashing expectation of a 2.1% rise). Take your pick of the US housing ‘recovery’ narrative.
The effect on the markets was non-existent with most traders having already left for the holiday leaving only the surprisingly subdued algos in charge.
- ETFs in the Spotlight
In case you missed the announcement and description of this section, you can read it here again.
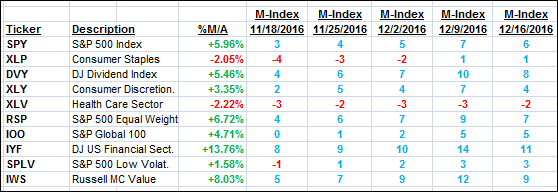
It features 10 broadly diversified ETFs from my HighVolume list as posted every Monday. Furthermore, they are screened for the lowest MaxDD% number meaning they have been showing better resistance to temporary sell offs than all others over the past year.
Here are the 10 candidates:
The above table simply demonstrates the magnitude with which some of the ETFs are fluctuating in regards to their positions above or below their respective individual trend lines (%M/A). A break below, represented by a negative number, shows weakness, while a break above, represented by a positive percentage, shows strength.
For hundreds of ETF choices, be sure to reference Thursday’s StatSheet.
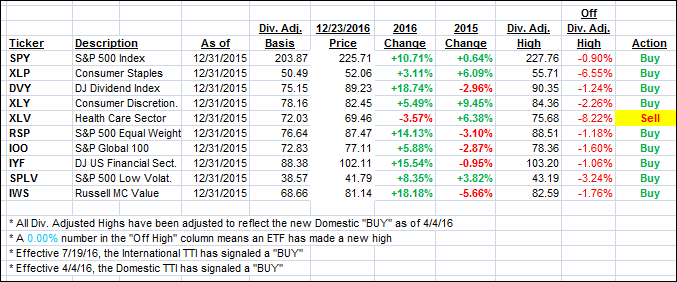
Year to date, here’s how the above candidates have fared so far:
Again, the first table above shows the position of the various ETFs in relation to their respective long term trend lines (%M/A), while the second one tracks their trailing sell stops in the “Off High” column. The “Action” column will signal a “Sell” once the -7.5% point has been taken out in the “Off High” column.
- Trend Tracking Indexes (TTIs)
Our Trend Tracking Indexes (TTIs) were mixed with the Domestic one gaining and the International one slipping a bit.
Here’s how we closed 12/23/2016:
Domestic TTI: +1.24% (last Friday +1.16%)—Buy signal effective 4/4/2016
International TTI: +2.20% (last Friday +2.85%)—Buy signal effective 7/19/2016
Merry Christmas!
Ulli…
Disclosure: I am obliged to inform you that I, as well as my advisory clients, own some of the ETFs listed in the above table. Furthermore, they do not represent a specific investment recommendation for you, they merely show which ETFs from the universe I track are falling within the guidelines specified.
————————————————————-
READER Q & A FOR THE WEEK
All Reader Q & A’s are listed at our web site!
Check it out at:
https://theetfbully.com/questions-answers/
———————————————————-
WOULD YOU LIKE TO HAVE YOUR INVESTMENTS PROFESSIONALLY MANAGED?
Do you have the time to follow our investment plans yourself? If you are a busy professional who would like to have his portfolio managed using our methodology, please contact me directly or get more details at:
https://theetfbully.com/personal-investment-management/
———————————————————
Back issues of the ETF/No Load Fund Tracker are available on the web at:
https://theetfbully.com/newsletter-archives/
Contact Ulli


