1. Moving the Markets
After early gains, U.S. stocks ended mixed following a steep drop Tuesday and a three-session bout of heightened volatility sparked by fears of rising interest rates.
Investors have been jittery of late. Worries include fears that higher interest rates will hurt the economy, overvalued stock prices and continued uncertainty over the presidential election, not to mention the strength of the economy. The biggest weight on the economy has been justifiable concern that the U.S. equities and other financial assets have been artificially inflated due to the easy-money policies of central bankers. That has raised fears of a long overdue correction to get prices better aligned with business fundamentals, such as corporate earnings and the slower growth rate of the U.S. economy.
There was big news in the Agriculture world today. Germany-based health and agricultural giant Bayer reached a deal to acquire St. Louis-based seed and pesticide firm Monsanto (MON) for $66 billion in yet another jolt to a global agricultural sector that has been rocked by sluggish crop prices. The good news for Monsanto is that Bayer agreed to pay a $2 billion breakup fee if the deal collapses under anti-trust pressure.
Oil prices, which fell 3% on Tuesday, and were a factor in the steep slide in stocks, have remained volatile today. However, by day’s end, a barrel of U.S.-produced crude was up 11 cents, or 0.2%, to $45.01 per barrel.
2. ETFs in the Spotlight
In case you missed the announcement and description of this section, you can read it here again.
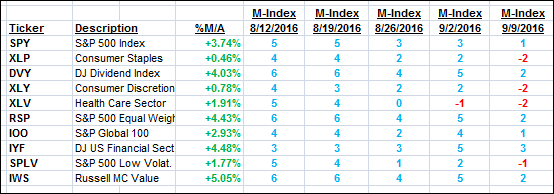
It features 10 broadly diversified ETFs from my HighVolume list as posted every Monday. Furthermore, they are screened for the lowest MaxDD% number meaning they have been showing better resistance to temporary sell offs than all others over the past year.
Here are the 10 candidates:

The above table simply demonstrates the magnitude with which some of the ETFs are fluctuating in regards to their positions above or below their respective individual trend lines (%M/A). A break below, represented by a negative number, shows weakness, while a break above, represented by a positive percentage, shows strength.
For hundreds of ETF choices, be sure to reference Thursday’s StatSheet.
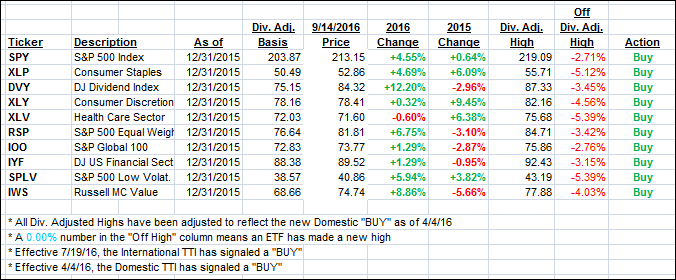
Year to date, here’s how the above candidates have fared so far:

Again, the first table above shows the position of the various ETFs in relation to their respective long term trend lines (%M/A), while the second one tracks their trailing sell stops in the “Off High” column. The “Action” column will signal a “Sell” once the -7.5% point has been taken out in the “Off High” column.
3. Trend Tracking Indexes (TTIs)
Our Trend Tracking Indexes (TTIs) hardly moved as an early rally faded into the close leaving the S&P 500 almost unchanged.
Here’s how we closed 9/14/2016:
Domestic TTI: +1.83% (last close +1.78%)—Buy signal effective 4/4/2016
International TTI: +3.32% (last close +3.31%)—Buy signal effective 7/19/2016
Disclosure: I am obliged to inform you that I, as well as my advisory clients, own some of the ETFs listed in the above table. Furthermore, they do not represent a specific investment recommendation for you, they merely show which ETFs from the universe I track are falling within the guidelines specified.
Contact Ulli