1. Moving the Markets
Wall Street was a mess today after the shooting in Florida this past Sunday morning. This unfortunate incident, alongside uncertainty ahead of the U.S. Federal Reserve’s meeting this week and on mounting concern about Britain’s possible exit from the European Union did not equate to a prosperous trading day in the market worldwide. Stocks in Asia and Europe tumbled as well.
Amongst the chaotic trading behavior on Wall Street today was news regarding a potential buyout deal with Microsoft and targeted LinkedIn. The word on the street is that Microsoft (MSFT) has made a bid $26.2 bil bid to buyout LinkedIn (LNKD). Shares of the social networking site soared 47% as the $196-a-share offer represents a nearly 50% premium over its Friday closing price of $131.08. Perhaps the buyout push is an effort to make up for Microsoft’s failing smart phone production efforts and their recent sell-off of Nokia.
The Fed begins a two-day meeting tomorrow and the general consensus is that the central bank will hold off on raising interest rates for the time being. Still, investors are anxious to hear how policymakers view the state of the economy here in the U.S. and if any hints will arise about what they might do with rate hikes at future meetings.
2. ETFs in the Spotlight
In case you missed the announcement and description of this section, you can read it here again.
It features 10 broadly diversified ETFs from my HighVolume list as posted every Monday. Furthermore, they are screened for the lowest MaxDD% number meaning they have been showing better resistance to temporary sell offs than all others over the past year.
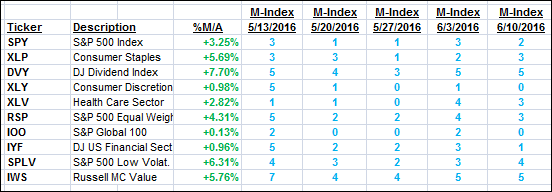
Here are the 10 candidates:

The above table simply demonstrates the magnitude with which some of the ETFs are fluctuating in regards to their positions above or below their respective individual trend lines (%M/A). A break below, represented by a negative number, shows weakness, while a break above, represented by a positive percentage, shows strength.
For hundreds of ETF/Mutual fund choices, be sure to reference Thursday’s StatSheet.
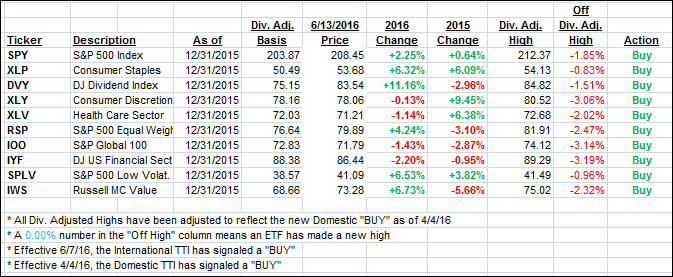
Year to date, here’s how the above candidates have fared so far:

Again, the first table above shows the position of the various ETFs in relation to their respective long term trend lines (%M/A), while the second one tracks their trailing sell stops in the “Off High” column. The “Action” column will signal a “Sell” once the -7.5% point has been taken out in the “Off High” column.
3. Trend Tracking Indexes (TTIs)
Our Domestic Trend Tracking Index (TTI) pulled back while the International one took a dive back into bearish territory as world markets sold off. Here, again, I will wait for more downside confirmation before declaring this latest International “Buy” another whip-saw signal.
Here’s how we ended up:
Domestic TTI: +1.69% (last close +1.93%)—Buy signal effective 4/4/2016
International TTI: -0.93% (last close +0.30%)—Buy signal effective 6/7/2016
Disclosure: I am obliged to inform you that I, as well as advisory clients of mine, own some of these listed ETFs. Furthermore, they do not represent a specific investment recommendation for you, they merely show which ETFs from the universe I track are falling within the guidelines specified.
Contact Ulli