ETF/No Load Fund Tracker StatSheet
————————————————————-
————————————————————
Market Commentary
BREXIT SHATTERS COMPLACENCY—THE MORNING AFTER

1. Moving the Markets
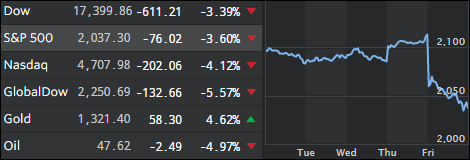
What a difference a day makes. There we were closing in on all-time new highs on the S&P 500 on Thursday and just one day later, we’re heading the other direction in a big way with the U.S. stock market suffering its worst drop in 10 months. The British decided via their referendum to leave the European Union, which was won 52% to 48% in favor of the “Leave” folks. Good for them as they now will be able again to make independent decisions about their country without the mandatory input of their EU overlords.
Worldwide, equities got spanked with the most damage being done to the Nikkei and the various European indexes. Domestically, the major indexes went south as well, but to a lesser degree as the table above shows. King of the hill was gold and gold miners, which rallied +4.62% and +5.91% respectively.
Sure, it looks like the Fed’s plan of raising interest rates this year has gone out the window and not just because of the Brexit result but also due to ever sliding economic data points, which makes an eventual rate cut far more likely than a hike.
The big question is: Will there be more selling ahead? It’s certainly a possibility as some big investors using leverage are bound to get some margin calls, which may push markets lower along with continued fears of more fallout from the EU as other counties appear to be waiting on deck ready for their own version of Brexit.
Of course, there are always dip buyers out there looking to catch the falling knife hoping for a rebound. However, as trend followers, we don’t concern ourselves with these issues but are watching the major trends as identified by our Trend Tracking Indexes (TTIs). Both have been affected, and you can read the details in section 3 below.
2. ETFs in the Spotlight
In case you missed the announcement and description of this section, you can read it here again.
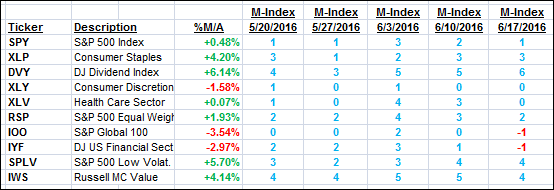
It features 10 broadly diversified ETFs from my HighVolume list as posted every Monday. Furthermore, they are screened for the lowest MaxDD% number meaning they have been showing better resistance to temporary sell offs than all others over the past year.
Here are the 10 candidates:

The above table simply demonstrates the magnitude with which some of the ETFs are fluctuating in regards to their positions above or below their respective individual trend lines (%M/A). A break below, represented by a negative number, shows weakness, while a break above, represented by a positive percentage, shows strength.
For hundreds of ETF/Mutual fund choices, be sure to reference Thursday’s StatSheet.
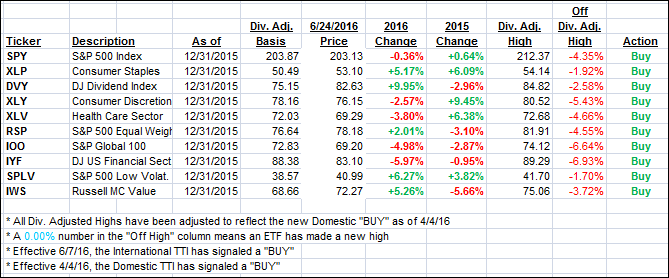
Year to date, here’s how the above candidates have fared so far:

Again, the first table above shows the position of the various ETFs in relation to their respective long term trend lines (%M/A), while the second one tracks their trailing sell stops in the “Off High” column. The “Action” column will signal a “Sell” once the -7.5% point has been taken out in the “Off High” column.
3. Trend Tracking Indexes (TTIs)
Our Domestic Trend Tracking Index (TTI) took a dive as word markets got clobbered. However, we remain on the bullish side of the trend line as you can see below. Any more selling next week followed by a trend line break, and we will be moving back to the safety of the sidelines. With the markets having been manipulated to these lofty levels, which represents an overvaluation of some 30%, there is great risk to the downside meaning we will follow any “Sell” signal to the latter.
The International TTI, after rallying sharply on Thursday, shifted into reverse and moved from yesterday’s +2.38% to -3.17% in one day! With this indicator having displayed extreme volatility, I will watch its movement for maybe 1 or 2 days next week and if there is no momentum improvement, I will issue a “Sell” signal for that arena. As an aside, in my advisor practice, we did not participate in the last 2 International “Buys.”
Here’s how we ended this week:
Domestic TTI: +0.66% (last Friday +1.36%)—Buy signal effective 4/4/2016
International TTI: -3.10% (last Friday -1.40%)—Buy signal effective 6/7/2016
Have a great weekend.
Ulli…
Disclosure: I am obliged to inform you that I, as well as advisory clients of mine, own some of these listed ETFs. Furthermore, they do not represent a specific investment recommendation for you, they merely show which ETFs from the universe I track are falling within the guidelines specified.
————————————————————-
READER Q & A FOR THE WEEK
All Reader Q & A’s are listed at our web site!
Check it out at:
https://theetfbully.com/questions-answers/
———————————————————-
WOULD YOU LIKE TO HAVE YOUR INVESTMENTS PROFESSIONALLY MANAGED?
Do you have the time to follow our investment plans yourself? If you are a busy professional who would like to have his portfolio managed using our methodology, please contact me directly or get more details at:
https://theetfbully.com/personal-investment-management/
———————————————————
Back issues of the ETF/No Load Fund Tracker are available on the web at:
https://theetfbully.com/newsletter-archives/
Contact Ulli