1. Moving the Markets
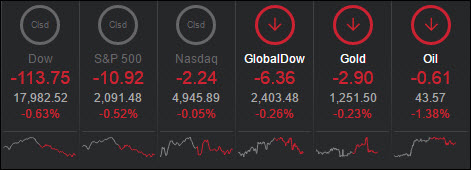
Many investors were laying in waiting to see what the ECB’s decision was going to be in regards to raising interest rates. As expected, the ECB stood pat on rates earlier Thursday and began the implementation of its larger asset-purchase program, which now totals 80 billion euros a month. However, President Mario Draghi did not rule out future rate cuts to fight low inflation and stagnant growth in the eurozone.
In earnings news, Microsoft (MSFT) reported a drop in revenue and earnings amidst trying to steer the corporate direction from desktop PCs to the modern age of emerging portable technologies. The tech giant dropped 5% in fiscal Q3 revenue to $20.5 billion and earnings fell from $5 billion to $3.8 billion. Shares dropped 4% on the day.
As I have been anticipating, SunEdison (SUNE) filed for Chapter 11 bankruptcy reorganization today. Foul accounting practices were cited as the reason that the company came under scrutiny over the past year. They also had piled up debt totaling $16 billion in liabilities. The stock is now at $0.34 a share.
2. ETFs in the Spotlight
In case you missed the announcement and description of this section, you can read it here again.
It features 10 broadly diversified ETFs from my HighVolume list as posted every Monday. Furthermore, they are screened for the lowest MaxDD% number meaning they have been showing better resistance to temporary sell offs than all others over the past year.
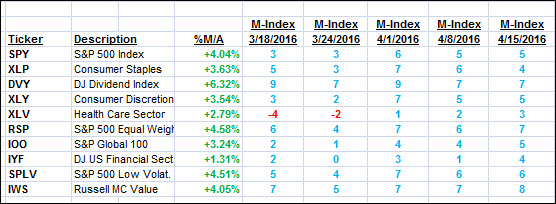
Here are the 10 candidates:

The above table simply demonstrates the magnitude with which some of the ETFs are fluctuating in regards to their positions above or below their respective individual trend lines (%M/A). A break below, represented by a negative number, shows weakness, while a break above, represented by a positive percentage, shows strength.
For hundreds of ETF/Mutual fund choices, be sure to reference Thursday’s StatSheet.
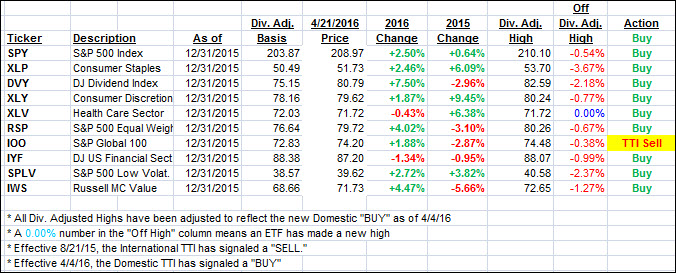
Year to date, here’s how the above candidates have fared so far:

Again, the first table above shows the position of the various ETFs in relation to their respective long term trend lines (%M/A), while the second one tracks their trailing sell stops in the “Off High” column. The “Action” column will signal a “Sell” once the -7.5% point has been taken out in the “Off High” column.
3. Trend Tracking Indexes (TTIs)
Our Domestic Trend Tracking Index (TTI) slipped as the major indexes retreated.
I’m still watching the International TTI to confirm some staying power above the line before calling this a new Buy signal.
Here’s how we ended up:
Domestic TTI: +1.82% (last close +2.02%)—Buy signal effective 4/4/2016
International TTI: +0.87% (last close +0.95%)—Sell signal effective 8/21/2015
Disclosure: I am obliged to inform you that I, as well as advisory clients of mine, own some of these listed ETFs. Furthermore, they do not represent a specific investment recommendation for you, they merely show which ETFs from the universe I track are falling within the guidelines specified.
Contact Ulli