ETF/No Load Fund Tracker StatSheet
————————————————————-
————————————————————
Market Commentary
MARKETS POST GAINS FOR SECOND WEEK OF APRIL

1. Moving the Markets
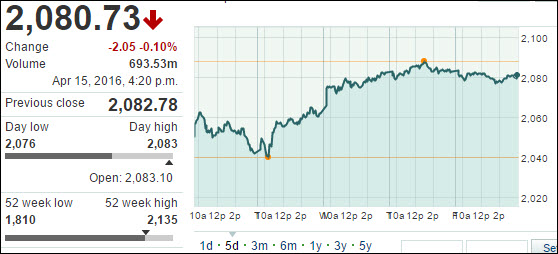
Although markets closed slightly lower on Friday, they remained in positive territory for the week. The 3-day rally from Tuesday to Thursday helped stocks continue on a bullish path.
We heard news from China today that the country’s first-quarter growth came in at 6.7%, which was pretty much in line with expectations. However, this is the country’s slowest pace of growth over the last seven years. Markets in China seemed to remain steady though after the news. The Shanghai composite fell just 0.13%.
While China’s numbers did not impress, most investors here are focusing more on the fact that the Dow is once again approaching the 18,000 mark. The index sits at 17,897 today. The last time the Dow touched the 18,000 mark was July of last year. Breaking the mark once again could help catapult stocks forward despite absolutely horrific underlying economic data points ranging from a surge in inventory-to-sales, plunging industrial production and tumbling retail sales.
If that has you scratching your head, remember the current level and upward trajectory of the equity markets have absolutely nothing to do with economic reality; they are merely a function of the Fed’s dovish stance on interest rates.
2. ETFs in the Spotlight
In case you missed the announcement and description of this section, you can read it here again.
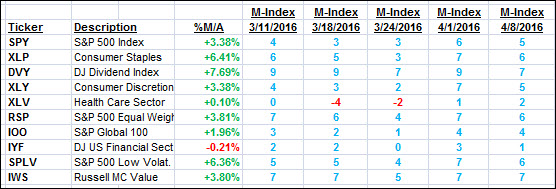
It features 10 broadly diversified ETFs from my HighVolume list as posted every Monday. Furthermore, they are screened for the lowest MaxDD% number meaning they have been showing better resistance to temporary sell offs than all others over the past year.
Here are the 10 candidates:

The above table simply demonstrates the magnitude with which some of the ETFs are fluctuating in regards to their positions above or below their respective individual trend lines (%M/A). A break below, represented by a negative number, shows weakness, while a break above, represented by a positive percentage, shows strength.
For hundreds of ETF/Mutual fund choices, be sure to reference Thursday’s StatSheet.
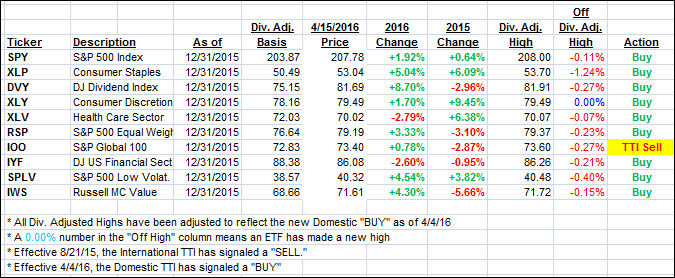
Year to date, here’s how the above candidates have fared so far:

Again, the first table above shows the position of the various ETFs in relation to their respective long term trend lines (%M/A), while the second one tracks their trailing sell stops in the “Off High” column. The “Action” column will signal a “Sell” once the -7.5% point has been taken out in the “Off High” column.
3. Trend Tracking Indexes (TTIs)
Our Domestic Trend Tracking Index (TTI) moved deeper into bullish territory while its International cousin showed some improved upward momentum as well and could very well generate a new Buy signal in the near future.
Here’s how we closed this week:
Domestic TTI: +1.80% (last Friday +1.19%)—Buy signal effective 4/4/2016
International TTI: -0.36% (last Friday -2.72%)—Sell signal effective 8/21/2015
Have a great weekend.
Ulli…
Disclosure: I am obliged to inform you that I, as well as advisory clients of mine, own some of these listed ETFs. Furthermore, they do not represent a specific investment recommendation for you, they merely show which ETFs from the universe I track are falling within the guidelines specified.
————————————————————-
READER Q & A FOR THE WEEK
All Reader Q & A’s are listed at our web site!
Check it out at:
https://theetfbully.com/questions-answers/
———————————————————-
WOULD YOU LIKE TO HAVE YOUR INVESTMENTS PROFESSIONALLY MANAGED?
Do you have the time to follow our investment plans yourself? If you are a busy professional who would like to have his portfolio managed using our methodology, please contact me directly or get more details at:
https://theetfbully.com/personal-investment-management/
———————————————————
Back issues of the ETF/No Load Fund Tracker are available on the web at:
https://theetfbully.com/newsletter-archives/
Contact Ulli