1. Moving the Markets
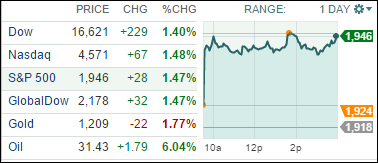
After posting its best weekly gain in what has been a dismal start to 2016, stocks kicked off the new week in rally mode as investors reacted to rising oil prices and signs of alleged stability in China’s stock market. Well, there really was no stability but the naming of a new regulator to police the markets is supposed to be a sign that things are under control.
However, economic data points were horrible not just out of Europe but also domestically with the PMI (Purchasing Managers Index) showing the weakest numbers since 2012, so we’are back to the theme that bad news is good news.
Boosting market sentiment to start the week was a big jump in the price of U.S.-produced crude back above the key $30 per barrel mark, which pulled equities higher, however, crude oil news headlines were negative with falling demand and increasing supply framing the big picture. Shorts were squeezed again supplying the upward momentum for this move.
Last week, stocks rallied sharply as investors swooped in to pick up some bargains after the steep selloff to start the year. Wall Street also got a boost from news that Saudi Arabia, Russia and other major oil producers were considering a production freeze, a move, if it comes to fruition, is seen as the first step to stabilize oil prices.
With the S&P 500 now bouncing against overhead resistance in the 1,950 area, I would not be surprised to see the indexes shift in reverse or at least pause until new momentum is found to justify not only the current levels but also a break through this glass ceiling. Still, at this point this entire rebound is nothing but a strong bear market rally, and we need to see far more momentum to push our Domestic TTI (section 3) back into bullish territory.
2. ETFs in the Spotlight
In case you missed the announcement and description of this section, you can read it here again.
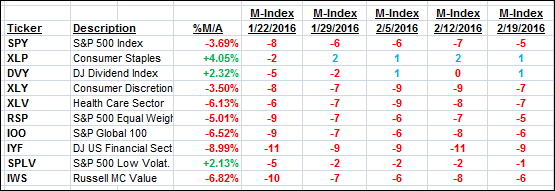
It features 10 broadly diversified ETFs from my HighVolume list as posted every Monday. Furthermore, they are screened for the lowest MaxDD% number meaning they have been showing better resistance to temporary sell offs than all others over the past year.
Here are the 10 candidates:

The above table simply demonstrates the magnitude with which some of the ETFs are fluctuating in regards to their positions above or below their respective individual trend lines (%M/A). A break below, represented by a negative number, shows weakness, while a break above, represented by a positive percentage, shows strength.
For hundreds of ETF/Mutual fund choices, be sure to reference Thursday’s StatSheet.
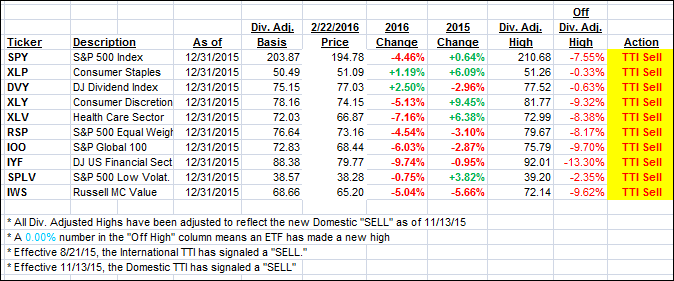
Year to date, here’s how the above candidates have fared so far:

Again, the first table above shows the position of the various ETFs in relation to their respective long term trend lines (%M/A), while the second one tracks their trailing sell stops in the “Off High” column. The “Action” column will signal a “Sell” once the -7.5% point has been taken out in the “Off High” column.
3. Trend Tracking Indexes (TTIs)
Our Domestic Trend Tracking Index (TTI) declined again as the indexes stayed on last week’s bullish path.
Here’s how we ended up:
Domestic TTI: -1.54% (last close -2.04%)—Sell signal effective 11/13/2015
International TTI: -8.31% (last close -9.19%)—Sell signal effective 8/21/2015
Disclosure: I am obliged to inform you that I, as well as advisory clients of mine, own some of these listed ETFs. Furthermore, they do not represent a specific investment recommendation for you, they merely show which ETFs from the universe I track are falling within the guidelines specified.
Contact Ulli