1. Moving the Markets
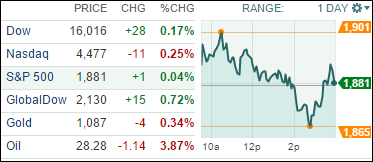
The major U.S. stock indexes kicked off the trading week in a mixed fashion. U.S. stocks, still reeling from its worst yearly start ever, were able to close mostly higher in a bumpy trading session as traders shook off fears after China’s 2015 economic growth hit its lowest level in 25 years, but was not as bad as feared. GDP growth for 2015 in China came in at 6.9%, which is the lowest growth rate since 1990.
Keeping gains in check was another sharp drop in the price of U.S.-produced crude, which was off $1.03, or 3.5%, to close at $28.37 a barrel.
Some earnings reports from big players came in today. Better than expected earnings from Bank of America (BAC) and Morgan Stanley (MS) lifted investor spirits for the moment. So did Netflix (NFLX). The online streaming giant posted 4th quarter earnings that surpassed expectations, mostly due to new international subscribers.
The market is in dire need of a positive earnings season to get some upward momentum restored. On the other hand, the S&P 500 dipped again below its crucial support level of 1,867 today, although it did so only on an intra-day basis. Any close below that point, might invite more selling bringing in the 1,800 level in a hurry. If you are still bullish, you better hope for some blowout earnings to stem the bearish tide.
6 of our 10 ETFs in the Spotlight edged higher during this mixed session with most indexes going sideways. Heading the leaders was Consumer Staples (XLP) with +1.20% while on the downside the Mid-Cap Value ETF (IWS) gave back -0.67%.
2. ETFs in the Spotlight
In case you missed the announcement and description of this section, you can read it here again.
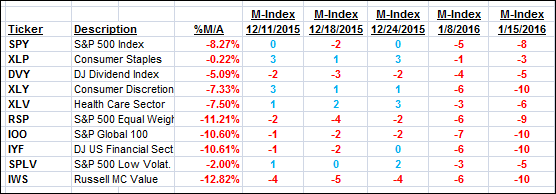
It features 10 broadly diversified ETFs from my HighVolume list as posted every Monday. Furthermore, they are screened for the lowest MaxDD% number meaning they have been showing better resistance to temporary sell offs than all others over the past year.
Here are the 10 candidates:

The above table simply demonstrates the magnitude with which some of the ETFs are fluctuating in regards to their positions above or below their respective individual trend lines (%M/A). A break below, represented by a negative number, shows weakness, while a break above, represented by a positive percentage, shows strength.
For hundreds of ETF/Mutual fund choices, be sure to reference Thursday’s StatSheet.
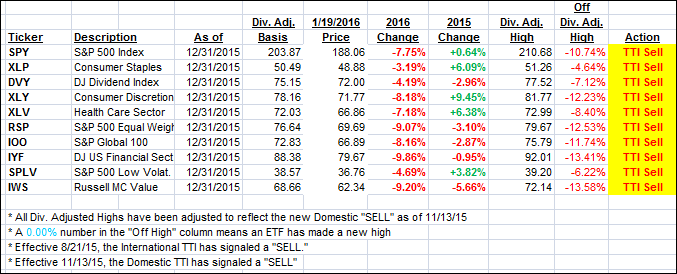
Year to date, here’s how the above candidates have fared so far:

Again, the first table above shows the position of the various ETFs in relation to their respective long term trend lines (%M/A), while the second one tracks their trailing sell stops in the “Off High” column. The “Action” column will signal a “Sell” once the -7.5% point has been taken out in the “Off High” column.
3. Trend Tracking Indexes (TTIs)
Our Domestic Trend Tracking Index (TTI) slipped just a tad as the major indexes were stuck in a sideways session. We remain bearish and on the sidelines.
Here’s how we closed:
Domestic TTI: -3.63% (last close -3.56%)—Sell signal effective 11/13/2015
International TTI: -11.44% (last close -11.51%)—Sell signal effective 8/21/2015
Disclosure: I am obliged to inform you that I, as well as advisory clients of mine, own some of these listed ETFs. Furthermore, they do not represent a specific investment recommendation for you, they merely show which ETFs from the universe I track are falling within the guidelines specified.
Contact Ulli