ETF/No Load Fund Tracker StatSheet
————————————————————-
THE LINK TO OUR CURRENT ETF/MUTUAL FUND STATSHEET IS:
————————————————————
Market Commentary
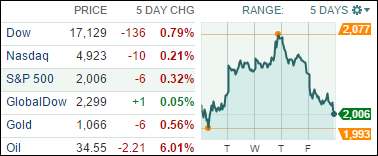
EQUITIES GET SPANKED BY SLIDING CRUDE PRICES AND OPTIONS EXPIRY

[Chart courtesy of MarketWatch.com]
1. Moving the Markets
One look at the above chart tells the story. The euphoric “Fed High” did not last, the morning after hangover sat it in and the major indexes took a steep dive over the past 2 days closing the week lower but not by much. The S&P and Dow had their worst 2-day performance since September 1.
The culprits to this week’s debacle were the usual suspects: The continued swoon of oil prices, what the Fed’s announcement really means, a weakening global economy and the event du jour was quadruple options expiration day. The chart definitely resembles a black diamond slope with the indexes closing at their lowest point of the day, which may not bode well for Monday’s opening.
With the holidays upon us, I expect volume to slow down, and it remains to be seen if that might contribute to a Santa Claus rally next week.
All of our 10 ETFs in the Spotlight headed south as equities got hammered. The surprising leader to the downside was the conservative Consumer Staples ETF (XLP) with -2.49%, while the Mid-Cap Value (IWS) was the best performer with a loss of “only” -1.48%.
Our bearish outlook was confirmed again, as section 3 below shows, and a 100% cash position is my preferred choice.
2. ETFs in the Spotlight
In case you missed the announcement and description of this section, you can read it here again.
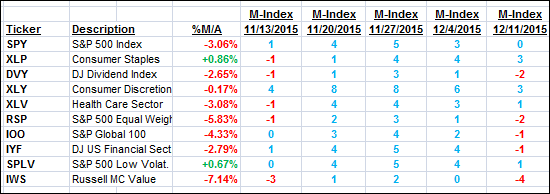
It features 10 broadly diversified ETFs from my HighVolume list as posted every Monday. Furthermore, they are screened for the lowest MaxDD% number meaning they have been showing better resistance to temporary sell offs than all others over the past year.
Here are the 10 candidates:

The above table simply demonstrates the magnitude with which some of the ETFs are fluctuating in regards to their positions above or below their respective individual trend lines (%M/A). A break below, represented by a negative number, shows weakness, while a break above, represented by a positive percentage, shows strength.
For hundreds of ETF/Mutual fund choices, be sure to reference Thursday’s StatSheet.
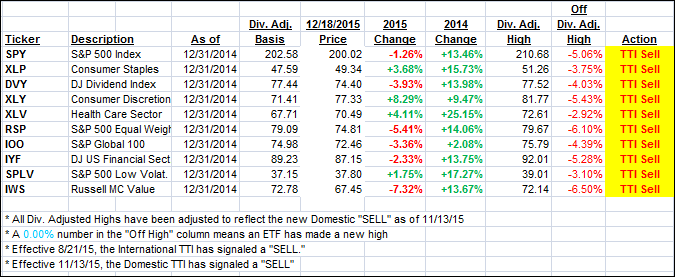
Year to date, here’s how the above candidates have fared so far:

Again, the first table above shows the position of the various ETFs in relation to their respective long term trend lines (%M/A), while the second one tracks their trailing sell stops in the “Off High” column. The “Action” column will signal a “Sell” once the -7.5% point has been taken out in the “Off High” column.
3. Trend Tracking Indexes (TTIs)
Our Domestic Trend Tracking Index (TTI) took a dive today as equities got pulled off their “Fed Highs” and sank deeper into bear market territory. We remain on the sidelines and will watch how this debacle plays out.
Here’s how we ended an extreme volatile week:
Domestic TTI: -1.39% (last Friday -1.19%)—Sell signal effective 11/13/2015
International TTI: -6.06% (last Friday -5.85%)—Sell signal effective 8/21/2015
Have a great weekend.
Ulli…
Disclosure: I am obliged to inform you that I, as well as advisory clients of mine, own some of these listed ETFs. Furthermore, they do not represent a specific investment recommendation for you, they merely show which ETFs from the universe I track are falling within the guidelines specified.
————————————————————-
READER Q & A FOR THE WEEK
All Reader Q & A’s are listed at our web site!
Check it out at:
https://theetfbully.com/questions-answers/
———————————————————-
WOULD YOU LIKE TO HAVE YOUR INVESTMENTS PROFESSIONALLY MANAGED?
Do you have the time to follow our investment plans yourself? If you are a busy professional who would like to have his portfolio managed using our methodology, please contact me directly or get more details at:
https://theetfbully.com/personal-investment-management/
———————————————————
Back issues of the ETF/No Load Fund Tracker are available on the web at:
https://theetfbully.com/newsletter-archives/
Contact Ulli