1. Moving the Markets
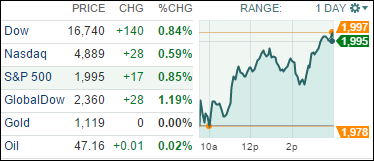
Stocks rallied Wednesday afternoon with the Dow gaining 140 points on the day, after the Federal Reserve kicked off its long-awaited 2-day policy meeting on interest rates. In one of the most important Fed meetings in recent times, economists and analysts alike are divided on whether the Fed will move forward to raise interest rates.
A quarter of a percentage point boost in the fed funds rate likely would marginally push up borrowing costs for consumers and businesses, including mortgages, car loans and corporate bonds, tempering such borrowing and, as a result, economic activity. However, some economists say it’s time to start gradually raising rates for the first time in nearly a decade given that the U.S. job market has allegedly more or less recovered. Others argue rates should remain on hold amid global stock market turmoil and China’s slowdown, among other factors. Which side will win out? We’ll find out tomorrow.
On the earnings front, FedEx (FDX) reported quarterly profit of $2.42 per share, which was 4 cents below estimates, with revenue matching forecasts. CEO Fred Smith said the company is doing well considering weaker than expected global economic conditions. Separately, FedEx will increase rates by 4.9% at its FedEx Express service, which will take effect on Jan.4. The stock closed down 2.84%. Also, Oracle (ORCL) gained slightly today after the company beat analysts’ earnings forecasts but posted disappointing revenue numbers in its first fiscal quarter earnings report. The main problem, it seems, is that software license sales are falling as the tech world shifts to Web-delivered cloud products.
All of our 10 ETFs in the Spotlight stayed with this week’s upward momentum and closed higher. The winner of the day was the Mid-Cap Value ETF (IWS) with +1.24%, while the laggard was Healthcare with +0.28%.
2. ETFs in the Spotlight
In case you missed the announcement and description of this section, you can read it here again.
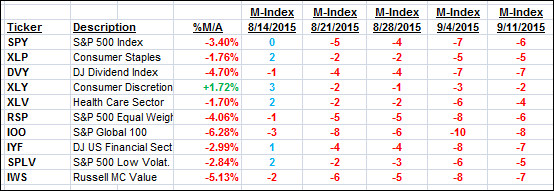
It features 10 broadly diversified ETFs from my HighVolume list as posted every Monday. Furthermore, they are screened for the lowest MaxDD% number meaning they have been showing better resistance to temporary sell offs than all others over the past year.
Here are the 10 candidates:
The above table simply demonstrates the magnitude with which some of the ETFs are fluctuating in regards to their positions above or below their respective individual trend lines (%M/A). A break below, represented by a negative number, shows weakness, while a break above, represented by a positive percentage, shows strength.
For hundreds of ETF/Mutual fund choices, be sure to reference Thursday’s StatSheet.
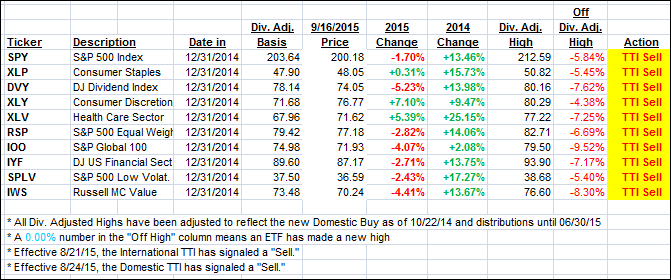
Year to date, here’s how the above candidates have fared so far:
Again, the first table above shows the position of the various ETFs in relation to their respective long term trend lines (%M/A), while the second one tracks their trailing sell stops in the “Off High” column. The “Action” column will signal a “Sell” once the -7.5% point has been taken out in the “Off High” column.
3. Trend Tracking Indexes (TTIs)
Our Trend Tracking Indexes (TTIs) improved again but still remain in bearish territory.
Here’s how we closed:
Domestic TTI: -1.06% (last close -1.52%)—Sell signal effective 8/24/2015
International TTI: -3.97% (last close -5.22%)—Sell signal effective 8/21/2015
Until the respective trend lines get clearly broken to the upside, we are staying on the sidelines.
Disclosure: I am obliged to inform you that I, as well as advisory clients of mine, own some of these listed ETFs. Furthermore, they do not represent a specific investment recommendation for you, they merely show which ETFs from the universe I track are falling within the guidelines specified.
Contact Ulli


