1. Moving the Markets
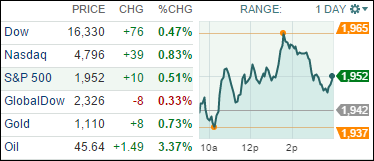
U.S. stocks rebounded a bit today after Wednesday’s wild ride that ended on a down note. Everyone is bracing for next week’s Federal Reserve meeting on interest rates and the vibes are still wait-and-see.
The Fed will meet for two days on Sept. 16-17, which could result in the first interest rate hike in almost a decade. Low rates, of course, have been cited as a key driver of the big stock market rally over the past 6 years. Investors globally have been biting their nails in anticipation of the potential rate hike, but it has continually been delayed over and over again. Only time will tell if and when the rate hike will take place. My best guess is that they will delay again…
In the auto world, we heard that Fiat Chrysler Automobiles is recalling nearly 1.7 million recent-model Ram pickups to check or repair wiring harnesses, airbags and steering components that may be faulty. The largest of the three recalls announced today involves an estimated 1.1 million pickups sold in North America that may have steering-wheel wiring harnesses that wear because of contact with a spring and could inadvertently set off the truck’s airbag.
And in oil news, oil prices pared some of their gains today after a reported increase of 2.6 million barrels in crude supplies for the week ended Sept. 4. However, energy traders it seems still await further indications on the supply-demand balance in U.S. markets. A week earlier, U.S. crude stockpiles rose by 4.7 million barrels, significantly above expectations for a build of 700,000. At 455.4 million barrels, U.S. crude oil inventories remain near levels not seen for this time of year in at least the last 80 years.
Our 10 ETFs in the Spotlight followed this week’s roller-coaster ride and closed higher as Healthcare (XLV) took the lead with +0.96%. Lagging behind was the Select Dividend ETF with +0.15%.
2. ETFs in the Spotlight
In case you missed the announcement and description of this section, you can read it here again.
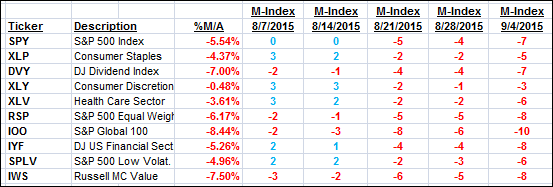
It features 10 broadly diversified ETFs from my HighVolume list as posted every Monday. Furthermore, they are screened for the lowest MaxDD% number meaning they have been showing better resistance to temporary sell offs than all others over the past year.
Here are the 10 candidates:
The above table simply demonstrates the magnitude with which some of the ETFs are fluctuating in regards to their positions above or below their respective individual trend lines (%M/A). A break below, represented by a negative number, shows weakness, while a break above, represented by a positive percentage, shows strength.
For hundreds of ETF/Mutual fund choices, be sure to reference Thursday’s StatSheet.
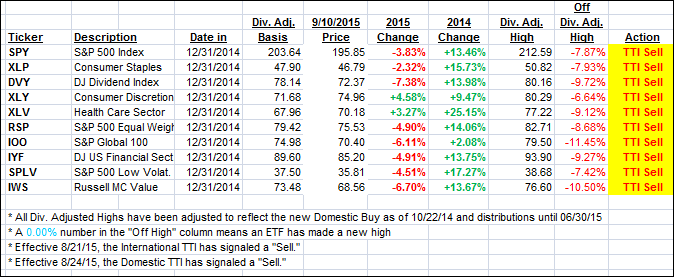
Year to date, here’s how the above candidates have fared so far:
Again, the first table above shows the position of the various ETFs in relation to their respective long term trend lines (%M/A), while the second one tracks their trailing sell stops in the “Off High” column. The “Action” column will signal a “Sell” once the -7.5% point has been taken out in the “Off High” column.
3. Trend Tracking Indexes (TTIs)
Our Trend Tracking Indexes (TTIs) joined the indexes and closed up a fraction but still remain in bearish territory by the following percentages:
Domestic TTI: -2.03% (last close -2.24%)—Sell signal effective 8/24/2015
International TTI: -5.29% (last close -5.44%)—Sell signal effective 8/21/2015
Disclosure: I am obliged to inform you that I, as well as advisory clients of mine, own some of these listed ETFs. Furthermore, they do not represent a specific investment recommendation for you, they merely show which ETFs from the universe I track are falling within the guidelines specified.
Contact Ulli


