ETF/No Load Fund Tracker StatSheet
————————————————————-
THE LINK TO OUR CURRENT ETF/MUTUAL FUND STATSHEET IS:
————————————————————
Market Commentary
INDEXES RALLY WITH THE NASDAQ MAKING A NEW ALL-TIME HIGH
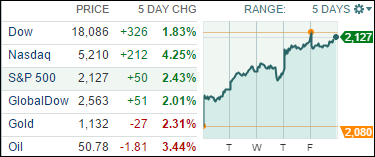
[Chart courtesy of MarketWatch.com]1. Moving the Markets
One look at the 5-day chart tells the story of the past week. The bulls had their way with the Nasdaq making a new high supported by Google’s better-than-estimated earnings.
The S&P 500 added 2.4% but lagged a little as its energy share component declined. Still, the index managed to rally within 5 points of its all-time high. Earnings so far have provided some ammunition for this rebound, which also received an assist by the agreement of Greece and its creditors.
For the S&P it was its biggest weekly gain in 4 months, even though most of the rally was based on nothing but hope that the Greek resolution will hold and that the free-fall in Chinese equities has been contained.
Domestically, we heard that Fed chair Yellen is still talking about a rate increase this year; new-home construction climbed in June, the cost of living increased and consumer confidence declined.
Today, only 2 of our 10 ETFs in the Spotlight eked out a gain with the leader being the Global 100 (IOO), which added 0.45%. On the downside, the Dividend ETF (DVY) ruled by giving back -0.83%.
2. ETFs in the Spotlight
In case you missed the announcement and description of this section, you can read it here again.
It features 10 broadly diversified ETFs from my HighVolume list as posted every Monday. Furthermore, they are screened for the lowest MaxDD% number meaning they have been showing better resistance to temporary sell offs than all others over the past year.
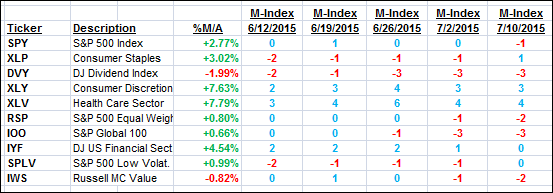
Here are the 10 candidates:
The above table simply demonstrates the magnitude with which some of the ETFs are fluctuating in regards to their positions above or below their respective individual trend lines (%M/A). A break below, represented by a negative number, shows weakness, while a break above, represented by a positive percentage, shows strength.
For hundreds of ETF/Mutual fund choices, be sure to reference Thursday’s StatSheet.
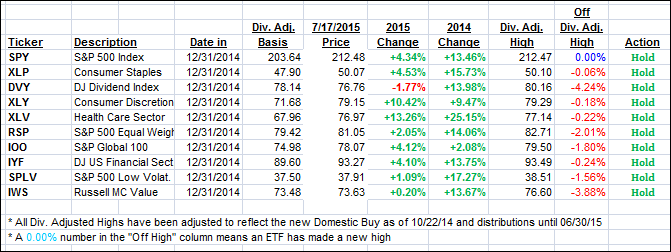
Year to date, here’s how the above candidates have fared so far:
Again, the first table above shows the position of the various ETFs in relation to their respective long term trend lines (%M/A), while the second one tracks their trailing sell stops in the “Off High” column. The “Action” column will signal a “Sell” once the -7.5% point has been taken out in the “Off High” column.
3. Trend Tracking Indexes (TTIs)
Our Trend Tracking Indexes (TTIs) recovered from last week’s low and moved deeper into bullish territory.
Here’s how we ended up:
Domestic TTI: +1.72% (last Friday +0.80%)—Buy signal effective 10/22/2014
International TTI: +2.41% (last Friday +1.07%)—Buy signal effective 2/13/2015
Have a nice weekend.
Ulli…
Disclosure: I am obliged to inform you that I, as well as advisory clients of mine, own some of these listed ETFs. Furthermore, they do not represent a specific investment recommendation for you, they merely show which ETFs from the universe I track are falling within the guidelines specified.
————————————————————-
READER Q & A FOR THE WEEK
Reader Elaine:
Q: Ulli: As stated in your newsletter: “Please note that distributions are not included in the current momentum numbers.”
This is really a disappointment, because although I try to keep my own figures, I always double checked to see what you had listed to be sure I was correct. Just wanted to say I hope you are going to get your stat sheets up to date soon.
I know you are right on top of the ETF charts but I am sure there are still a lot of us out here that invest in Mutual Funds and rely on your info especially when it comes to the Trend Tracking-Sell/Stop Loss.
Just a small investor, but really have come to rely on your Sell/Stop Loss Doctrine. Miss those stat sheets with the correct DrawDown Percentage numbers.
Thanks for all you do and thank you so much for your newsletter.
A: Elaine: Well, as long as I have been doing the StatSheet (over 10 years), dividends have never been included since my data source simply does not provide these; never has! I have looked into other methods and, while they exist, I would lose most of my indicators if I were to change, which is simply not an acceptable trade off.
Most of the ETFs we use are for growth, and dividends have only a small impact on the DD numbers. Keep in mind that this is not an exact science. We are looking at the big picture here by trying to get out of the market when it matters, and whether that means at -7.45% or -7.87% is really immaterial.
Hope this helps.
All Reader Q & A’s are listed at our web site!
Check it out at:
http://www.successful-investment.com/q&a.php
———————————————————-
WOULD YOU LIKE TO HAVE YOUR INVESTMENTS PROFESSIONALLY MANAGED?
Do you have the time to follow our investment plans yourself? If you are a busy professional who would like to have his portfolio managed using our methodology, please contact me directly or get more details at:
https://theetfbully.com/personal-investment-management/
———————————————————
Back issues of the ETF/No Load Fund Tracker are available on the web at:
https://theetfbully.com/newsletter-archives/
Contact Ulli


