1. Moving the Markets
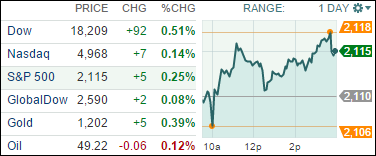
Stocks closed at record highs once again Tuesday as investors reacted positively to remarks from Janet Yellen and Greece won EU approval for its proposed budget reforms.
Yellen, in her semi-annual speech before the Senate banking committee, used a word familiar to investors when she reiterated that the central bank will be “patient” on raising interest rates for the first time since 2008. Traders seemed to take that as a sign that interest rates would remain unchanged through the fall.
In stock news, retailer Home Depot (HD) rose (4%) to a record $116.75 close after posting an 18% gain in quarterly profits and hiking its stock dividend 26%. Among other Dow components, General Electric (GE) rose 1% to $25.39 and JPMorgan (JPM) rose 2.5% to $60.82. The gain in JPM stock came as a surprise today; given the fact that JPMorgan announced plans to shed $100 billion in large deposits by the end of the year and is going to close 300 branch locations.
And in the EU, Greece’s left-wing government delivered a list of reforms to Brussels on the cusp of Monday night’s deadline, after the country and its creditors reached a tentative agreement last week to extend a rescue loan program by four months to avoid the risk of a Greek default and exit from the euro currency. Greece’s loans were originally due to expire on Feb. 28. A Greek government official said the reforms would focus on curbing tax evasion, corruption, smuggling and excessive bureaucracy while also addressing poverty caused by a six-year recession.
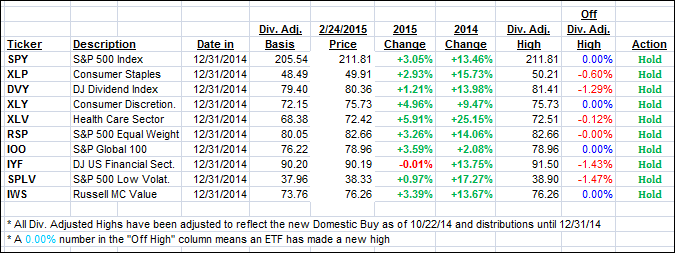
8 our 10 ETFs in the Spotlight higher with 4 of them making new highs as you can see in table 2 below.
2. ETFs in the Spotlight
In case you missed the announcement and description of this section, you can read it here again.
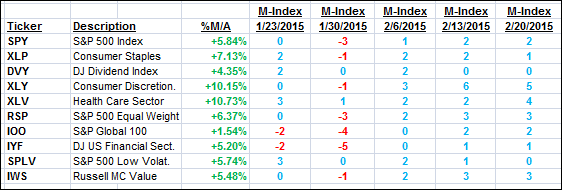
It features 10 broadly diversified ETFs from my HighVolume list as posted every Monday. Furthermore, they are screened for the lowest MaxDD% number meaning they have been showing better resistance to temporary sell offs than all others over the past year.
Here are the 10 candidates:
The above table simply demonstrates the magnitude with which some of the ETFs are fluctuating in regards to their positions above or below their respective individual trend lines (%M/A). A break below, represented by a negative number, shows weakness, while a break above, represented by a positive percentage, shows strength.
For hundreds of ETF/Mutual fund choices, be sure to reference Thursday’s StatSheet.
Year to date, here’s how the above candidates have fared so far:
Again, the first table above shows the position of the various ETFs in relation to their respective long term trend lines (%M/A), while the second one tracks their trailing sell stops in the “Off High” column. The “Action” column will signal a “Sell” once the -7.5% point has been taken out in the “Off High” column.
3. Trend Tracking Indexes (TTIs)
Our Trend Tracking Indexes (TTIs) followed the bullish tendencies and closed higher:
Here’s how we ended up:
Domestic TTI: +4.17% (last close +3.92%)—Buy signal effective 10/22/2014
International TTI: +3.97% (last close +3.76%)—Buy signal effective 2/13/2015
Disclosure: I am obliged to inform you that I, as well as advisory clients of mine, own some of these listed ETFs. Furthermore, they do not represent a specific investment recommendation for you, they merely show which ETFs from the universe I track are falling within the guidelines specified.
Contact Ulli


