
1. Moving the Markets
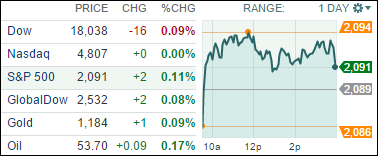
Stocks ended mixed today; however, the S&P 500 once again reached a record high. That marks the 53rd record close this year. Now is not the time to be shy at the pump, because oil prices fell another 2% with crude for Friday delivery settling at $53.61 a barrel.
Speaking of oil, Russia was back in focus today. The ruble tumbled after the economy showed signs of recession due to falling oil prices and sanctions from western governments. The country’s GDP shrank 0.5% in November year-over-year and isn’t showing signs of a quick recovery.
In M&A news, Walgreens (WAG) investors were happy today to hear that shareholders approved the final phase of the company’s acquisition of Alliance Boots. Alliance Boots is a leading international, pharmacy-led health and beauty group delivering a range of products and services to customers. The transaction is a corporate reorganization that will result in Walgreens becoming a wholly owned subsidiary of a company to be known as Walgreens Boots Alliance. As part of the reorganization, Walgreens is shifting its stock listing from the New York and Chicago stock exchanges to the Nasdaq exchange.
Regarding upcoming news, the New Year will bring a shortened holiday week, with the markets closed on New Year’s Day. Most attention will be on the ISM manufacturing index, as well as construction spending.
8 of our 10 ETFs in the Spotlight closed up with 6 of them making new highs as table 3 below shows.
2. ETFs in the Spotlight
In case you missed the announcement and description of this section, you can read it here again.
It features 10 broadly diversified ETFs from my HighVolume list as posted every Monday. Furthermore, they are screened for the lowest MaxDD% number meaning they have been showing better resistance to temporary sell offs than all others over the past year.
Here are the 10 candidates:
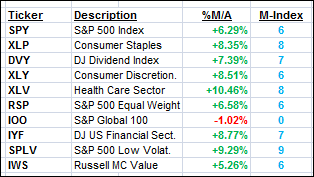
The above table simply demonstrates the magnitude with which some of the ETFs are fluctuating in regards to their positions above or below their respective individual trend lines (%M/A). A break below, represented by a negative number, shows weakness, while a break above, represented by a positive percentage, shows strength.
Year to date, here’s how the above candidates have fared so far:
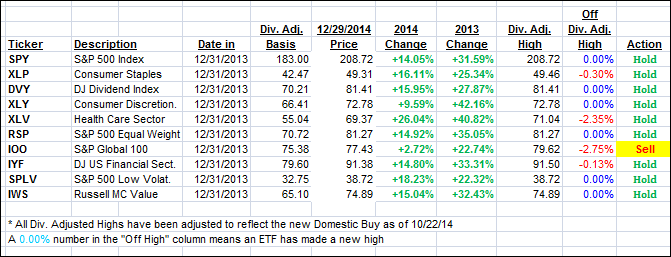
Again, the first table above shows the position of the various ETFs in relation to their respective long term trend lines (%M/A), while the second one tracks their trailing sell stops in the “Off High” column. The “Action” column will signal a “Sell” once the -7.5% point has been taken out in the “Off High” column.
3. Trend Tracking Indexes (TTIs)
Our Trend Tracking Indexes (TTIs) continued to inch higher but the International one still has not pierced its trend line to upside convincingly. So, I will wait a little longer before considering this a new bullish cycle.
Here’s how we stand as of today:
Domestic TTI: +3.45% (last close +3.26%)—Buy signal since 10/22/2014
International TTI: +0.43% (last close +0.28%)—New Sell signal effective 12/15/14
Disclosure: I am obliged to inform you that I, as well as advisory clients of mine, own some of these listed ETFs. Furthermore, they do not represent a specific investment recommendation for you, they merely show which ETFs from the universe I track are falling within the guidelines specified.
Contact Ulli
Comments 2
Hi Ulli
I want to thank you for giving us your postings freely. I have been a follower since 2009 when you had the model portfolios.
We got yanked around when it was a traders market and you gave that up and went to posting the ETF listings. I use your momentum index for buy and sell and the TTI for IN and Out criteria. Do you have any desire of starting fund portfolios up again. Thanks again!
Bob,
Thanks for your kind words. No, I have no intention of starting the model portfolios again. The 10 ETFs in the Spotlight offer far better choices and have proved to be superior in terms of performance. I have recently added the M-Index, so you can quickly identify which of the 10 is demonstrating better or worse momentum.
Ulli…