ETF/No Load Fund Tracker StatSheet
————————————————————-
THE LINK TO OUR CURRENT ETF/MUTUAL FUND STATSHEET IS:
————————————————————
Market Commentary
Thursday, July 3, 2014
IT’S ALL ABOUT THE DOW HEADED INTO 4TH OF JULY HOLIDAY
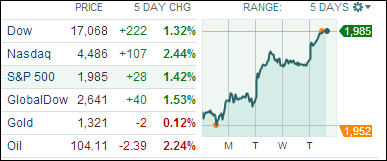
[Chart courtesy of MarketWatch.com]“The Dow finally did it!!” is what news headlines were screaming today. For the first time in history the Dow climbed and closed above the 17,000 mark. After coming within 2 points of 17,000 on Tuesday, the Dow finally cracked the 17,000 level after the government reported that a better-than-expected 288,000 jobs were created last month and the unemployment rate dipped to 6.1%, its lowest level since September 2008. Of course, these are just surface numbers. It’s been conveniently overlooked that we actually lost 500,000 full time jobs and gained some 800,000 part time jobs in the last month; truly a sad direction.
For the week, the Dow rose 1.3%, the S&P 500 advanced 1.25% and the Nasdaq climbed 2%.
Thursday’s gains were broad, with nine of the 10 primary S&P 500 sector indexes rising for the day. The only negative group was utilities, down 1.1%. The utilities sector (which has performed relatively well so far this year) is now struggling as the June jobs data suggested that the Federal Reserve may raise interest rates earlier than had previously been anticipated. Remember that investors favor utilities in a low interest-rate environment because the sector is a dividend play.
Let’s see if the markets can pick up where they left off after the 4th of July holiday.
Our 10 ETFs in the Spotlight gained for the week with 5 of them making new highs for the day.
2. ETFs in the Spotlight
In case you missed the announcement and description of this section, you can read it here again.
It features 10 broadly diversified ETFs from my HighVolume list as posted every Monday. Furthermore, they are screened for the lowest MaxDD% number meaning they have been showing better resistance to temporary sell offs than all others over the past year.
In other words, none of them ever triggered their 7.5% sell stop level during this time period, which included a variety of severe market pullbacks but no move into outright bear market territory.
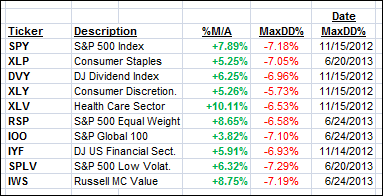
Here are the 10 candidates:
All of them are in “buy” mode, meaning their prices are above their respective long term trend lines by the percentage indicated (%M/A).
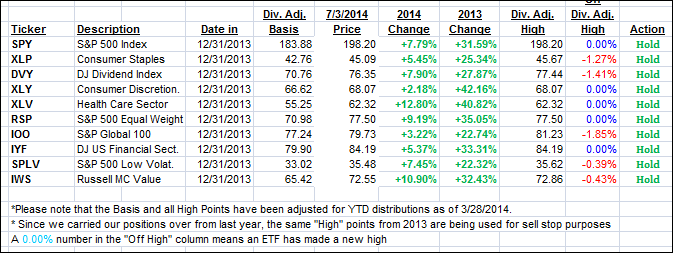
Year to date, here’s how the above candidates have fared so far:
To be clear, the first table above shows the position of the various ETFs in relation to their respective long term trend lines (%M/A), while the second one tracks their trailing sell stops in the “Off High” column. The “Action” column will signal a “Sell” once the -7.5% point is taken out in the “Off High” column.
3. Domestic Trend Tracking Indexes (TTIs)
Our Trend Tracking Indexes (TTIs) followed the bullish tendency and close the week higher:
Domestic TTI: +4.21% (last Friday +3.68%)
International TTI: +5.20% (last Friday +4.66%)
Happy 4th of July!
Ulli…
Disclosure: I am obliged to inform you that I, as well as advisory clients of mine, own some of these listed ETFs. Furthermore, they do not represent a specific investment recommendation for you, they merely show which ETFs from the universe I track are falling within the guidelines specified.
————————————————————-
READER Q & A FOR THE WEEK
All Reader Q & A’s are listed at our web site!
Check it out at:
http://www.successful-investment.com/q&a.php
A note from reader David:
Q: Ulli: Do your performance figures for ETF’s in the Spotlight assume reinvestment of cash dividends? Either way, how do you adjust performance figures to accurately reflect the gain?
A: David: For simplicity sake, I use dividend adjusted prices for the basis as the YTD table shows. Therefore, dividends are not reinvested, and the performance displayed represents the change in prices only for the period shown.
———————————————————-
WOULD YOU LIKE TO HAVE YOUR INVESTMENTS PROFESSIONALLY MANAGED?
Do you have the time to follow our investment plans yourself? If you are a busy professional who would like to have his portfolio managed using our methodology, please contact me directly or get more details at:
https://theetfbully.com/personal-investment-management/
———————————————————
Back issues of the ETF/No Load Fund Tracker are available on the web at:
https://theetfbully.com/newsletter-archives/
Contact Ulli


