1. Moving The Markets
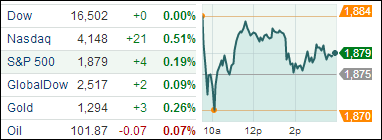
U.S. stocks inched higher as Apple’s (AAPL) strong earnings report proved to be not enough to ease fears over an escalating tension between Russia and Ukraine. The major indexes inched higher as the chart above shows.
Notable gainers today were Aetna (AET), who reported its first quarter EPS results of $1.98, beating the consensus estimate of $1.52; Caterpillar Inc (CAT) whose shares rose 1.8% to $105.28 after the company reported better-than-expected earnings and raised its full-year profit outlook; and Zimmer Holdings Inc (ZMH) who announced that it has agreed to buy Biomet Inc (LVBHAB) in a deal valued at about $13.35 billion to broaden its portfolio of products that treat bone and joint-related disorders. Zimmer’s stock surged 11.5% to $101.97.
The struggles in Ukraine continue to impact markets here in the U.S. Much of the volatility today was reportedly driven by comments from Russian Defense Minister Sergei Shoigu, who said Russia started military drills near the border with Ukraine. It was also reported that Ukrainian forces killed up to five pro-Moscow rebels as they closed in on the separatists’ military stronghold in the east. All those geopolitical concerns warrant instability and higher commodity prices; both of those are things Wall Street hates.
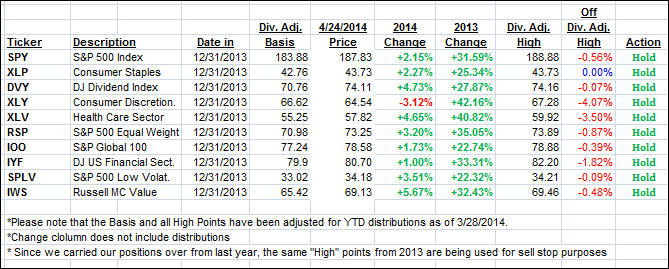
Our 10 ETFs in the Spotlight were mixed as 9 of them are remaining on the plus side YTD.
2. ETFs in the Spotlight
In case you missed the announcement and description of this section, you can read it here again.
It features 10 broadly diversified ETFs from my HighVolume list as posted every Monday. Furthermore, they are screened for the lowest MaxDD% number meaning they have been showing better resistance to temporary sell offs than all others over the past year.
In other words, none of them ever triggered their 7.5% sell stop level during this time period, which included a variety of severe market pullbacks but no move into outright bear market territory.
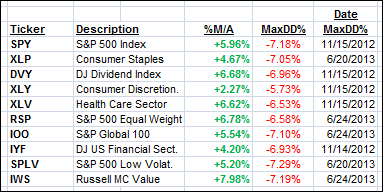
Here are the 10 candidates:
All of them are in “buy” mode, meaning their prices are above their respective long term trend lines by the percentage indicated (%M/A).
Year to date, here’s how the above candidates have fared so far:
To be clear, the first table above shows the position of the various ETFs in relation to their respective long term trend lines (%M/A), while the second one tracks their trailing sell stops in the “Off High” column. The “Action” column will signal a “Sell” once the -7.5% point is taken out in the “Off High” column.
3. Domestic Trend Tracking Indexes (TTIs)
Our Trend Tracking Indexes (TTIs) edged a tad higher:
Domestic TTI: +2.37% (last close +2.28%)
International TTI: +3.47% (last close +3.45%)
Disclosure: I am obliged to inform you that I, as well as advisory clients of mine, own some of these listed ETFs. Furthermore, they do not represent a specific investment recommendation for you, they merely show which ETFs from the universe I track are falling within the guidelines specified.
Contact Ulli


