After the prior week’s gain, the S&P 500 lost -2.54% since last Wednesday’s update. As a result, those ETF portfolios with mainly bond exposure gained, some stayed even and some lost slightly.
Again, any sharp market pullback, or gain for that matter, will not affect our models significantly due to the high cash holdings and only limited equity/sector positions.
At this point, with the markets seesawing based on the latest news from Europe, I see no reason to increase risky equity exposure. Despite the much hyped EU summit last weekend, nothing tangible to solve the immediate debt crisis has come out of the endless meetings.
In lieu of that continued uncertainty, I will only change my mind and add equity ETFs if market conditions along with momentum numbers improve.
Take a look at the latest update:
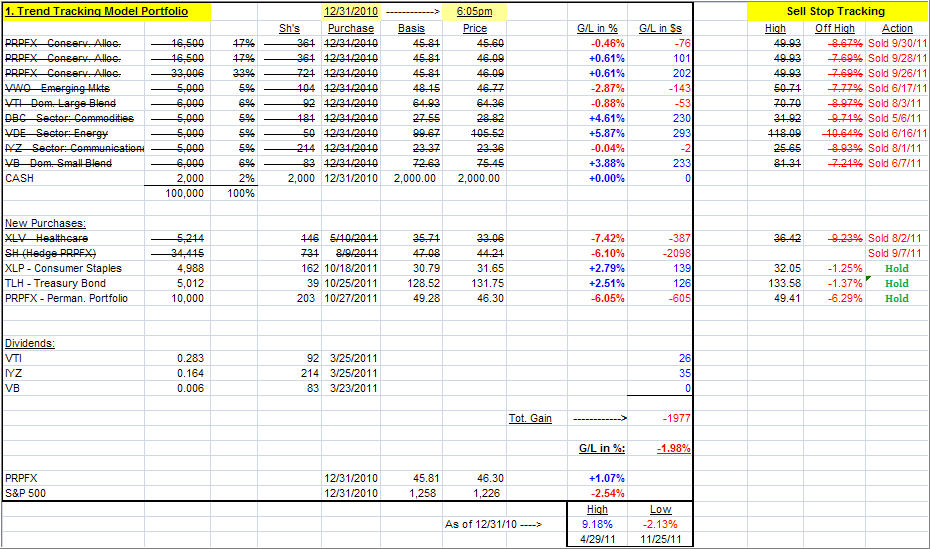
1. ETF Trend Tracking Model Portfolio
[Click on any table to enlarge]This is the portfolio allocation I predominantly use in my advisor practice. Given current market conditions, and an ever growing number of global hotspots, I like the concept of having a solid core holding in PRPFX, although we got stopped out as a result of the recent selloff.
Around this fund, when in buy mode, I add what I call boost components consisting of ETFs that can produce higher returns than my core holding, at least during bullish periods. When a market pullback occurs, the core holding should add an element of stability.
Nevertheless, as you know from my writings, anything I invest in involves the use of trailing sell stops, which are shown and tracked on the upper right of the table.
Last week, this portfolio was down YTD -1.61% vs. -1.98% as of today.
Why is this portfolio negative YTD? Since the markets did not follow through to the downside on 8/9/11, adding the short position and creating a hedge reduced our realized gains by some 2%. This is the cost we pay at times for downside protection.
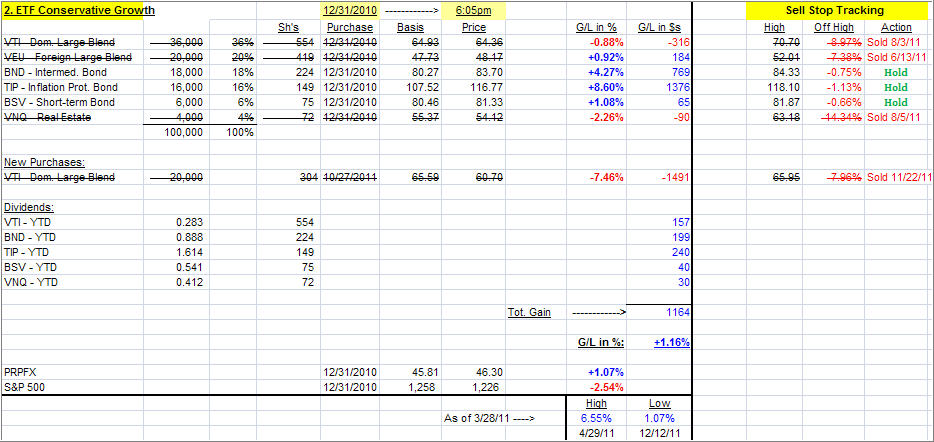
2. Conservative ETF Growth Portfolio
This portfolio, as are the following ones, would be typical of what is being used in the buy-and-hold community, as you can see by the 40% allocation to various bond ETFs. If you are conservative, this simple combination could work for you, but I still recommend the use of the trailing sell stops during these uncertain times.
Last week, this portfolio was up YTD +1.05% vs. +1.16% as of today.
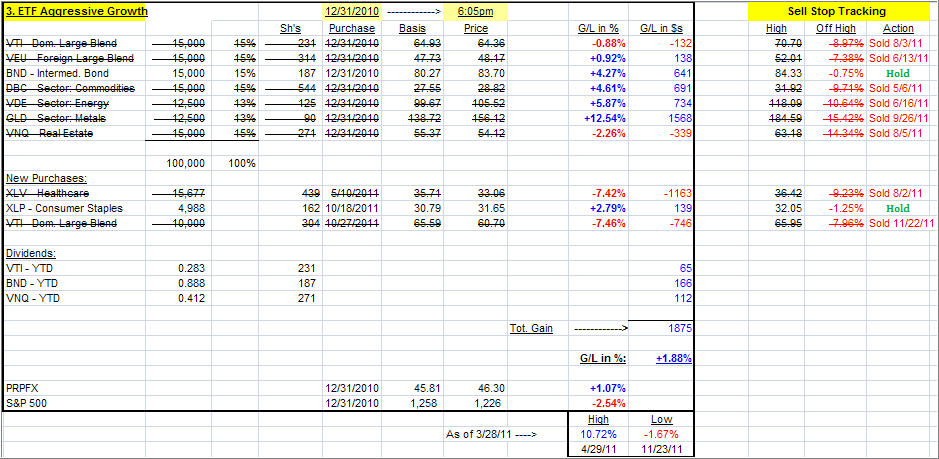
3. Aggressive ETF Growth Portfolio
What makes this one aggressive is the small 15% allocation to bonds. If you have an aggressive streak in your personality, you could consider this one. If you use my recommended sell stop discipline, you know exactly ahead of time what your downside risk will be.
Last week, this portfolio was up YTD +1.85% vs. +1.88% as of today.
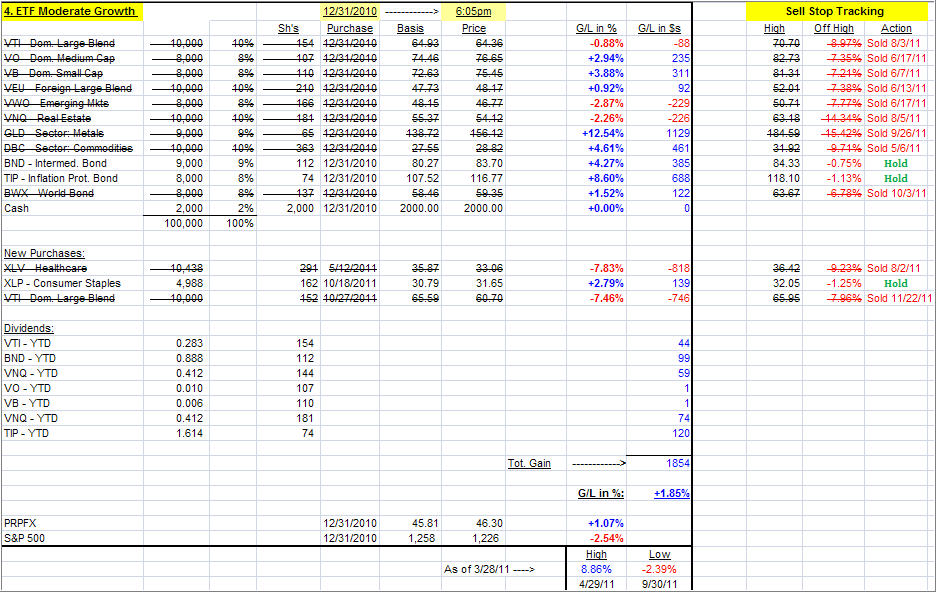
4. Moderate ETF Growth Portfolio
I call this one moderate growth, because of the higher allocation to various bond ETFs (26%) than in the aggressive set up above. It is also more diversfied domestically.
Last week, this portfolio was up YTD +1.85% vs. +1.85% as of today.
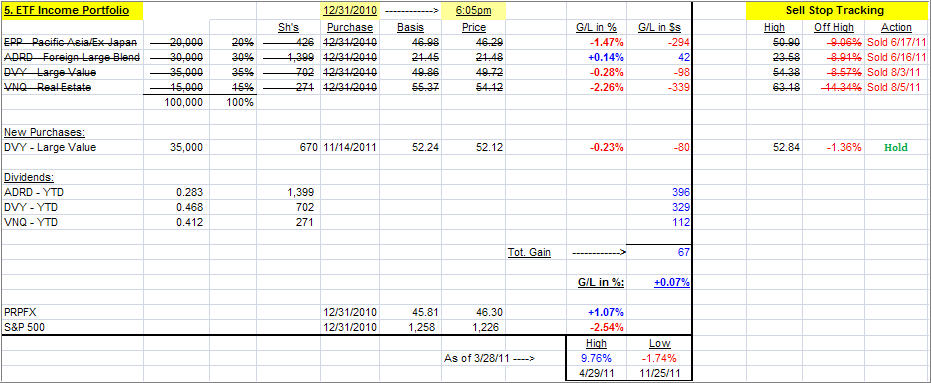
5. ETF Income Portfolio
This is as simple as it gets, but due to the recent sell-off, it dropped in value quickly due to no offsetting bond positions and showed a 0% invested balance by August 2011.
Last week, this portfolio was up YTD +0.55% vs. +0.07% as of today, as the new position in DVY so far has been a drag.
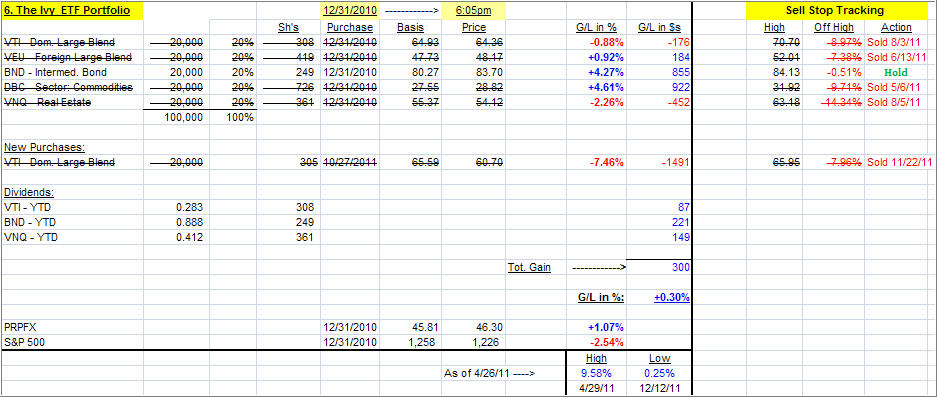
6. The Ivy ETF Portfolio
If you missed the recent post about the Ivy portfolio, you can read it here.
This is a simple 5-asset class portfolio with each individual component being bought when it crosses its respective trendline to the upside. Each component is being sold once it crosses its trend lines to the downside again, according to the author’s rules.
I have made 3 adjustments:
1. I apply a 39-week Simple Moving Average (SMA) to generate the Buys, while the authors use a 45-week SMA.
2. As mentioned in the blog post, I prefer using my trailing sell stop discipline for my exit strategy.
3. Personally. I favor using BND (as opposed to IEF) as my bond component, since it has shown more stabilty in the past.
Last week, the Ivy portfolio was up YTD +0.20% vs. +0.30% as of today.
7. The ETF Equivalent of PRPFX
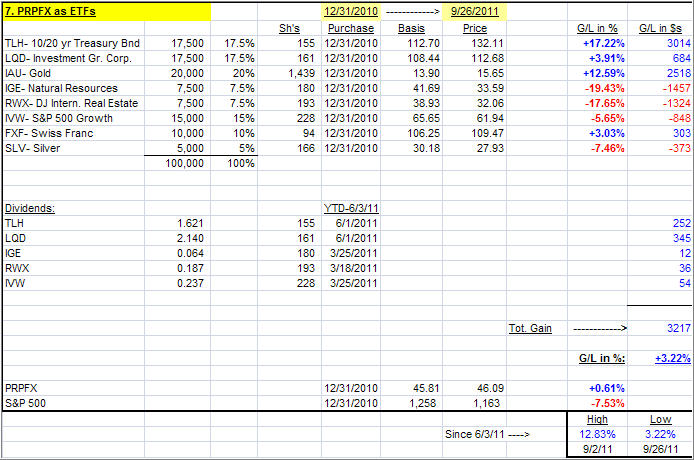
As posted recently, I have created and backtested the ETF equivalent, which clients of mine own as well, of my favorite mutual fund, PRPFX, which is a core holding in my #1 Portfolio. If you missed it, you can read the announcement here.
Take a look at the combination of ETFs:
In the current market environment, where just about all equity indexes have lost, this portfolio has bucked the trend and produced a remarkable result. While this is only one moment in time, and there are no guarantees that this will continue, we need to work here too with a trailing sell stop discipline to guard against excessive downside risk.
Since these 8 ETFs represent only one fund, namely PRPFX, we need to apply a different exit stratgey. For that purpose, I will not track the high points made for each ETF, as with the other 6 models, but measure my drop from the high point this entire portfolio has made. As a result, with last week’s slide in the metals, we got stopped out effective 9/26/11. The gain was +3.22%.
A new entry point, to reestablish the positions, will be once PRPFX climbs clearly back above its long-term trend line.
(ETF trading costs are not included in these portfolios demonstrations. They are intended to show market effects on differend scenarious only as an educational tool)
To repeat, the key to selecting a portfolio from the above list is not just performance. Personally, I’d rather lag a little on the upside but have some assurance that I will also lag when the downside comes into play.
I will update these portfolios every Wednesday.
Quick Reference:
Contact Ulli
