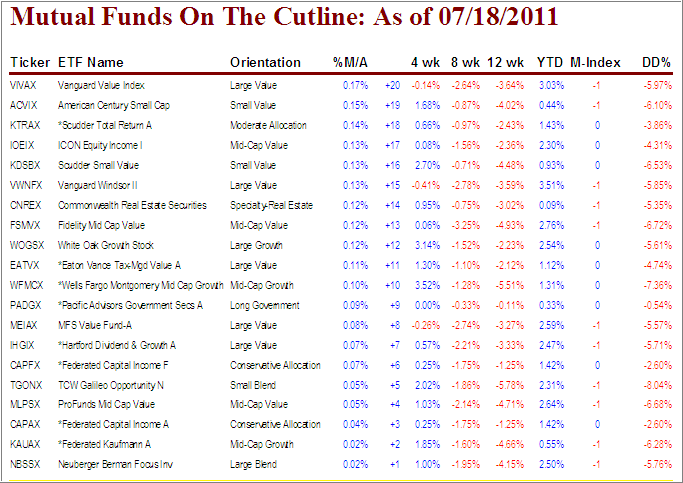
More downside momentum kicked in yesterday, as worries about the progress, or lack thereof, about the U.S. debt ceiling kept traders on edge. Supporting the sour mood were reports from Europe confirming utter confusion about the debt crisis with no clear leadership and/or plans emerging to attack the ever growing problems.
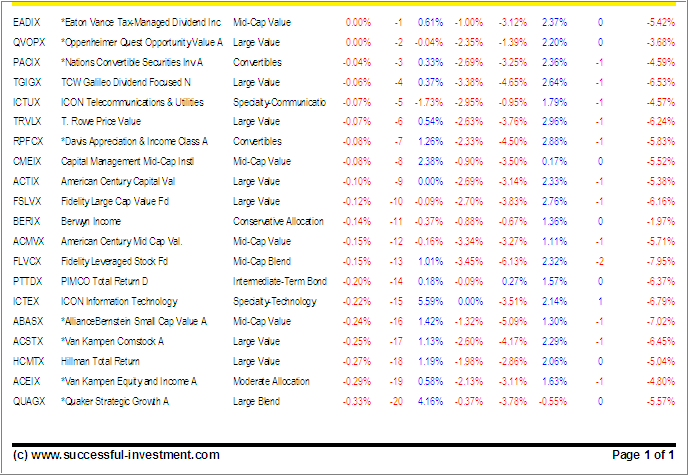
Just as last week, many funds have been meandering around the cutline with no obvious direction. The DrawDown figures (DD% column) leave a lot to be desired and are in many cases closer to triggering their trailing sell stop points than making new highs.
As I mentioned in yesterday’s ETF Cutline report, I am in the process of expanding the +20 listings to a range of up to +200. That will speed things up for you, if you are following specific funds, in that you will have all data in one place without having to resort to the weekly StatSheet.
Here’s this week’s mutual fund cutline report:
[Click on table to enlarge, copy and print]To repeat, most funds remain a “hold,” because of their high DrawDown numbers, even though they may be positioned on the bullish side of the cutline. Before making a commitment to purchase a new fund, you will want to see all momentum numbers on the plus side and the DD% figure to display 0.00%, or as close to it as you can find.
If you are new to this concept, 0.00% means that a fund has made a new high during this cycle; and that’s a good thing…
Quick reference to recent issues:
Disclosure: No holdings
Contact Ulli


Comments 2
Ulli, I know you mentioned it some where but I can’t find it. The %DD is down from the high but what high. Is it the 52 wk high? Thank you for such a fine product.
John,
It’s the high from the time the current Buy cycle started. In the case of the domestic mutual fund/ETF listings that would be 6/3/2009.
Ulli…