Yesterday’s drubbing was a direct result of global uncertainties, especially in Europe, but also China’s sharp rise in inflation did nothing to soothe the nerves on Wall Street.
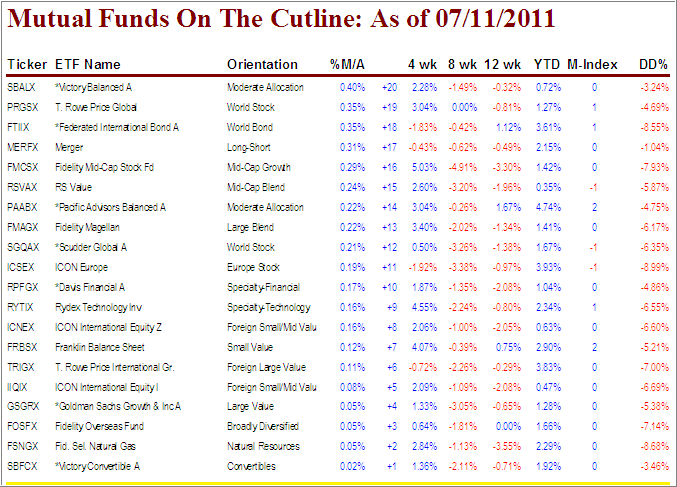
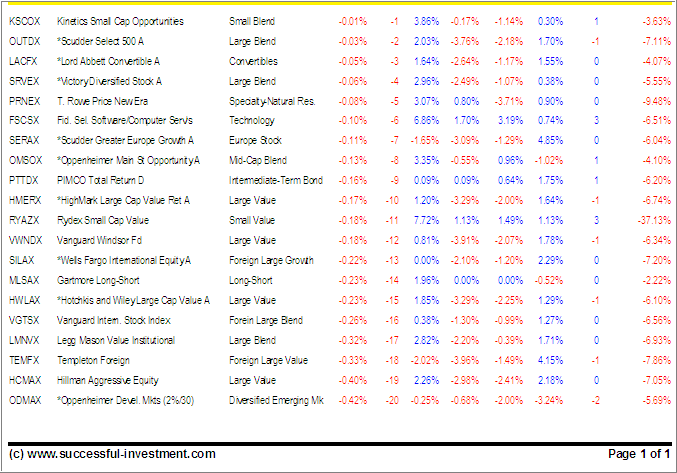
Many funds have been meandering around the cutline with no clear direction. While some momentum numbers have improved, the DrawDown figures (DD% column) leave a lot to be desired and are in many cases closer to triggering their trailing sell stop points than making new highs.
As I mentioned in yesterday’s ETF Cutline report, I am in the process of expanding the +20 listings to a range of up to +100. That will speed things up for you, if you are following specific funds, in that you will have all the data in one place without having to resort to the weekly StatSheet.
Here’s this week’s mutual fund cutline report:
[Click on table to enlarge, copy and print]
Again, most funds remain a “hold,” because of their high DrawDown numbers, even though they may be positioned on the bullish side of the cutline. Before making a commitment to purchase a new fund, you will want to see all momentum numbers on the plus side and the DD% figure to display 0.00%, or as close to it as you can find.
If you are new to this concept, 0.00% means that a fund has made a new high during this cycle; and that’s a good thing…
Quick reference to recent issues:
Disclosure: No holdings
Contact Ulli

