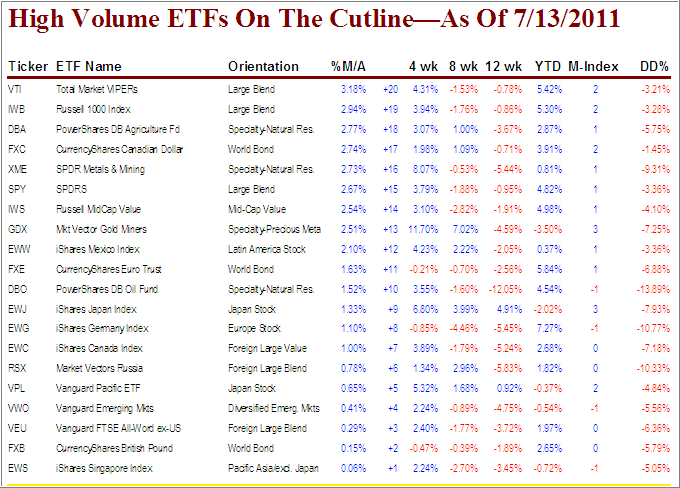
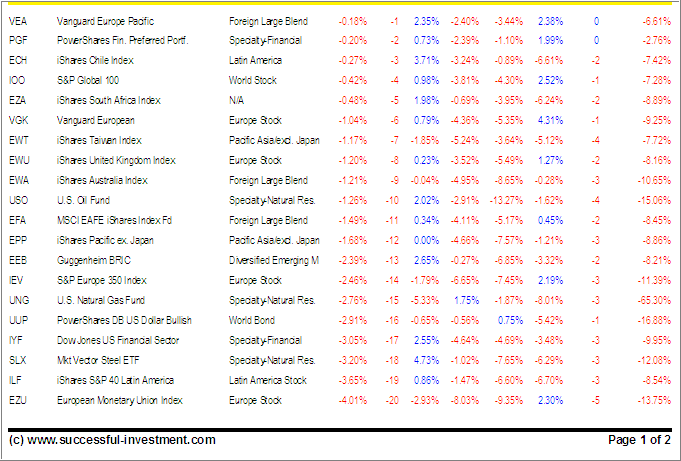
With the S&P 500 losing over 1.5% since last week’s HV Cutline report, even the latest featured heavyweight ETFs succumbed to bearish forces and dropped back below the cutline (long-term trend line).
To clarify, High Volume (HV) ETFs are defined as those with an average daily volume of $10 million or higher.
These ETFs are generated from my selected list of 90 that I use in my advisor practice. It cuts out the “noise,” which simply means it eliminates those ETFs that I would never buy because of their volume limitations.
With global uncertainty having now become a part of the daily investment theme, weakness has become apparent, market rallies seem to be short lived and tend to have the feel of dead cat bounces.
The debt circus is alive and well and seems to include more participants by the day, at least on the European side of the pond while, domestically, we’re stuck fighting the debt ceiling battle. All that does not bode well for a smooth ride for equities, as the last week has shown.
The ETFs featured in the most recent report, have now tanked and moved below their respective trend lines:
IOO (World Stock) from +20 to -4
IEV (S&P Europe 350) from +15 to -14
EFA (Foreign Large Blend) from +13 to -11
EEB (Diversified Emerging Mkts) from +7 to -13
Take a look at the table:
[Click on table to enlarge, copy and print]With the S&P 500 dancing around its 50-day moving average, the downside risk has clearly increased. Be alert, track your trailing sell stops and execute when necessary.
If you are a new reader and missed the original Cutline report, which also featured some “how to use” information, please review it here.
Quick Reference:
Disclosure: No holdings
Contact Ulli


Comments 2
Uli,
In computing the moving average Trends for US and the International are you using mutual fund results or ETF results? thank you.
Stan,
I developed the TTIs back in the 80s. There where only mutual funds available at that time, so that’s what they are based on.
Ulli…