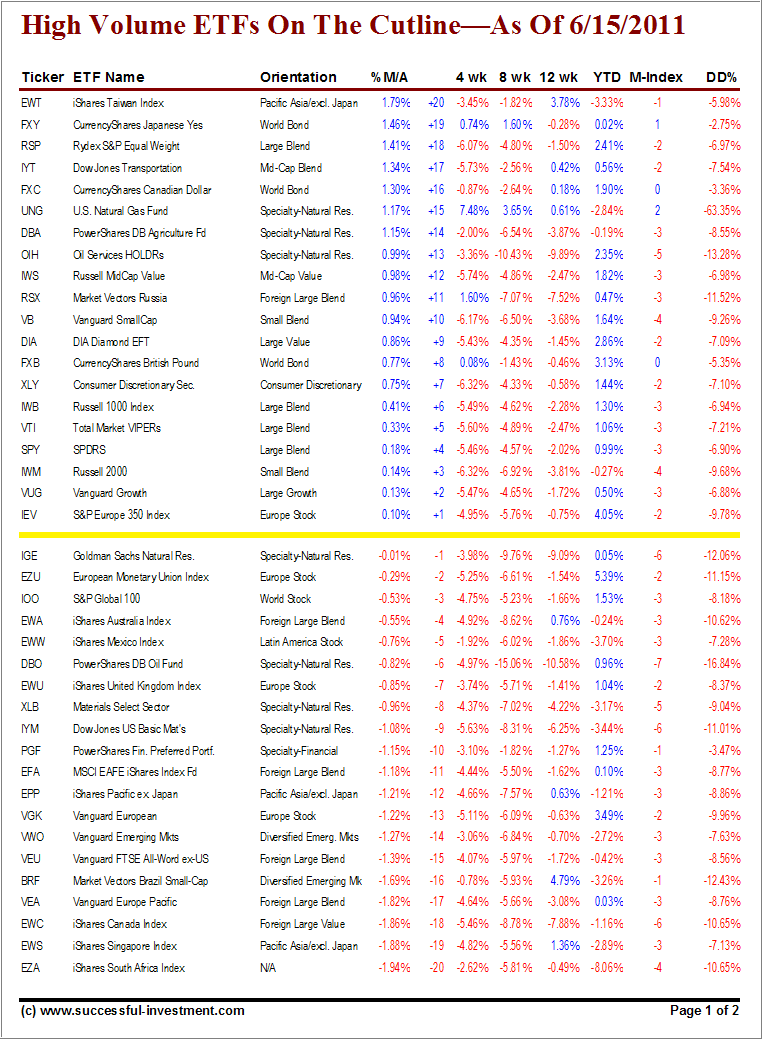
While Tuesday’s rebound raised hopes of a turn in short-term market direction, Wednesday’s sharp drop put an end to that hope – at least for the time being. Weakness in all areas of the market becomes especially clear in the High Volume Cutline report due to it covering only 90 ETFs.
To clarify, High Volume (HV) ETFs are defined as those with an average daily volume of $10 million or higher.
These ETFs are generated from my selected list of 90 that I use in my advisor practice. It cuts out the “noise,” which simply means it eliminates those ETFs that I would never buy because of their volume limitations.
Here are the changes in positions by some of the widely held indexes:
XLY (Consumer Discretionary) from +20 to +7.
VTI (Total Stock Market Index) from +19 to +5.
SPY (S&P 500) from +12 to +4.
IWM (Russell 2000) from +13 to +3
And sinking below the cutline were the following ETFs:
EFA (Foreign Large Blend) from +18 to -11.
VWO (Emerging Markets) from +7 to -14.
BRF (Brazil Small Cap) from +10 to -16
First, take a look at the table and then read my latest market update:
[Click on table to enlarge, copy and print]
As I posted in yesterday’s afternoon market comment, the benchmark S&P 500 has come within 0.20% of breaking below its 200-day moving average. If it does, more selling is very likely. This weakness is confirmed by other major indexes, such as VTI and IWM, which are barely hanging on above the line.
The international TTI has already signaled a sell, and there is a possibility that its domestic cousin will follow. This is not the time to attempt any bottom fishing but to lighten up on equity exposure the natural way; get out as your sell stops are being triggered.
If you are a new reader and missed the original Cutline report, which also featured some “how to use” information, please review it here.
Quick Reference:
Disclosure: Holdings in VWO, VTI
Contact Ulli
