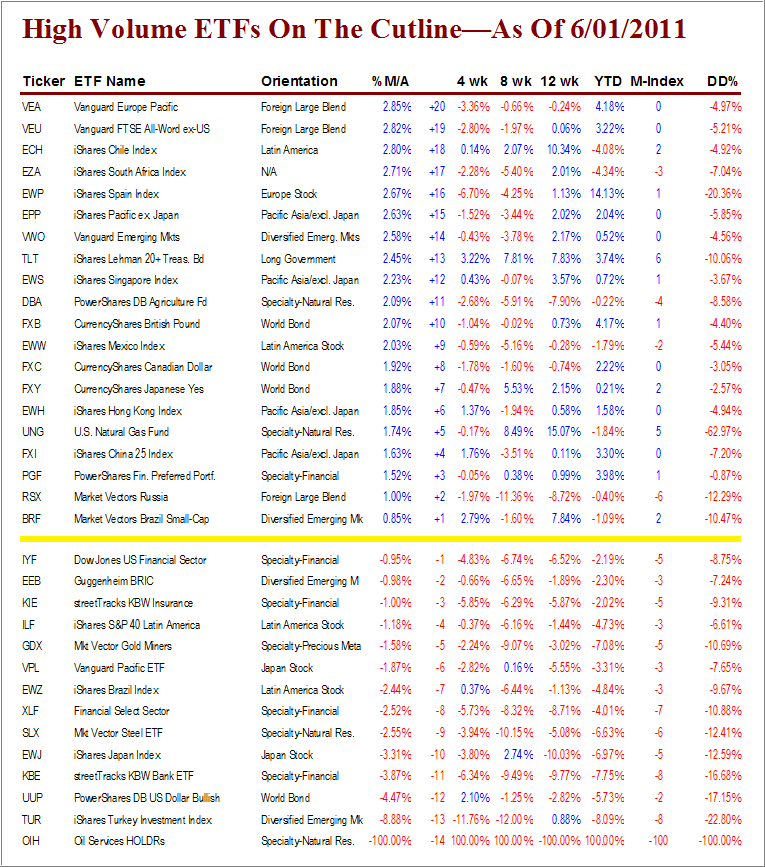
Despite yesterday’s sharp sell-off, the High Volume ETFs were affected very little, at least if you measure it from last Wednesday’s report.
To clarify, High Volume (HV) ETFs are defined as those with an average daily volume of $10 million or higher.
These ETFs are generated from my selected list of 90 that I use in my advisor practice. It cuts out the “noise,” which simply means it eliminates those ETFs that I would never buy because of their volume limitations.
With the S&P 500 only having dropped 5 points since last Wednesday, the changes in this week’s HV ETF Cutline report were modest with several ETFs actually climbing up the ladder:
Vanguard Europe Pacific (VEA) from +14 to +20
Vanguard All World-Ex.-U.S. (VEU) from +13 to +19
South Africa (EZA) from -1 to +17
Diversified emerging markets (VWO) from +4 to +14
China (FXI) from -2 to +4
Russia (RSX) from -3 to +2
Bucking the trend, and following the market down during yesterday’s pullback, was PGF (Financials), which dropped from +8 to +3.
PGF (Financials) has been the only ETFs above the cutline with positive momentum numbers, including a low DD% number of -0.87%, for a while. Its 4-wk performance has dropped slightly into the negative (-0.05%), but if you are holding it, it’s still a buy, subject to its trailing sell stop.
Take a look at the table:
*OIH: Data not available at time of publication
[Click on table to enlarge, copy and print]No other equity ETFs within the first 20 spots above the line are showing any improvements in terms of momentum numbers in order to be considered investment quality.
It’s a matter of fact, with the sharp sell-off still visible in the rear view mirror, be aware that more downside potential has been brought into play. That means, until upward momentum resumes, your focus should be on monitoring your exit strategy and, to a lesser degree, hunting for new buying opportunities.
If you are a new reader and missed the original Cutline report, which also featured some “how to use” information, please review it here.
Quick Reference:
Disclosure: Holdings in VEU, VWO
Contact Ulli

Comments 2
Thanks for the detailed table. I’m new to the letter; where is the TTI status located?
Jerome,
The TTIs can be located in the weekly StatSheet, which is posted every Thursday. Here is last week’s link:
https://theetfbully.com/2011/05/weekly-statsheet-for-the-etfno-load-fund-tracker-updated-through-5262011/
Ulli…