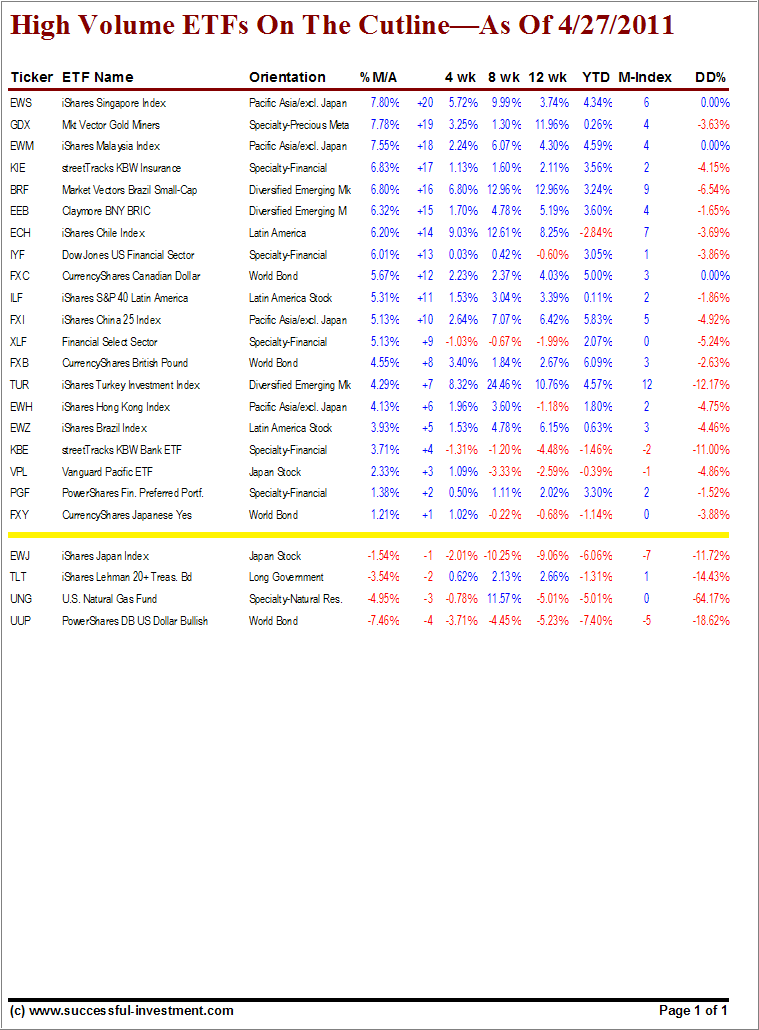
Here’s the latest update of the High Volume only ETFs, which are hovering slightly below and above their cutline (trend line). High Volume (HV) ETFs are defined as those with an average daily volume of $10 million or higher.
These ETFs are generated from my selected list of 90 that I use in my advisor practice. It cuts out the “noise,” which simply means it eliminates those ETFs that I would never buy because of their volume limitations.
Short ETFs are not yet included but will be at some point. Take a look at the table:
[Click on table to enlarge]
A couple of noteworthy changes were the emerging markets ETF (EEB) sliding from a +20 position last week to +15, while the Singapore ETF (EWS) gained the top spot at +20 from last week’s +16.
This simply demonstrates how market momentum affects funds differently. Both, FXY and PGF remained in their respective +1 and +2 positions, and the Japan index (EWJ) held steady at -1.
No doubt, you have been reading about the dollar weakening. You can see confirmation of that slippage as the dollar bullish ETF (UUP) slid from -3 to -4.
Again, most equity ETFs are literally off this chart at +21 or higher due to the bull market being almost 2 years old. The value of watching the cutline will come into play once a new bull market starts after the current one has come to an end; whenever that will be.
If you are a new reader and missed the original Cutline report, which also featured some “how to use” information, please review it here.
Quick Reference:
Contact Ulli

Comments 2
Why do you use $10M as a volume measure rather than the average number of shares traded? Doesn’t this tend to bias the measure towards high priced ETFs?
Lew,
That is simply my preferred measure, since I make portfolio allocations based on dollar amounts. It has nothing to do with higher priced ETFs.
Ulli…