Out of the 1,800+ ETFs out there, I only pick the ones that trade over $5 million per day (HV ETFs), so you don’t get stuck with a lemon that nobody wants to buy or sell.
Trend Tracking Indexes (TTIs)
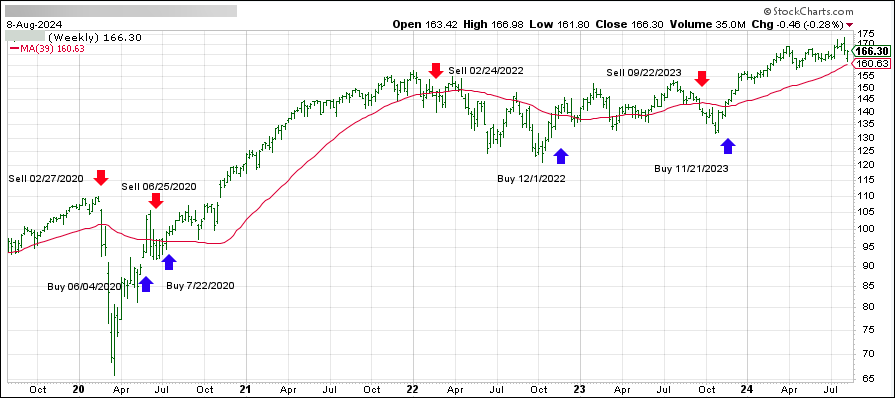
These are the main indicators that tell you when to buy or sell Domestic and International ETFs (section 1 and 2). They do that by comparing their position to their long-term M/A (Moving Average). If they cross above, and stay there, it’s a green light to buy. If they fall below, and keep going, it’s a red light to sell. And to make sure you don’t lose your shirt if things go south, I also use a 12% trailing stop loss on all positions in these categories.
All other investment areas don’t have a TTI and should be traded based on the position of each ETF relative to its own trend line (%M/A). That’s why I call them “Selective Buy.” In other words, if an ETF goes above its own trend line, you can buy it. But don’t forget to use a trailing sell stop of 12%, or less if you’re feeling nervous.
If some of these words sound like Greek to you, please check out the Glossary of Terms and new subscriber information in section 9.
DOMESTIC EQUITY ETFs: BUY— since 11/21/2023
Click on chart to enlarge
This is our main compass, the Domestic Trend Tracking Index (TTI-green line in the above chart). It has broken above its long-term trend line (red) by +3.56% and is in “Buy” mode as posted.
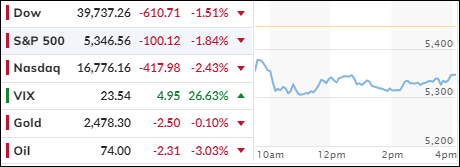
After yesterday’s comeback session, bullish sentiment persisted in the markets as traders attempted to recover some of the recent losses. However, the bears ultimately took control, causing major indexes to reverse and close in the red. The Dow experienced its worst five-day start to a month in six years.
The tech sector failed to maintain its early rally, with mega-cap stocks all posting losses exceeding 2%. Notably, Super Micro Computer plummeted by approximately 20% due to earnings misses, followed by Airbnb, which saw a 15% decline.
Although yesterday’s rebound provided some relief and lifted all 11 sectors of the S&P 500, its sustainability remains uncertain. We are navigating tumultuous times, with unresolved issues such as Black Monday’s selloff, banking, debt, and deficits looming in the background.
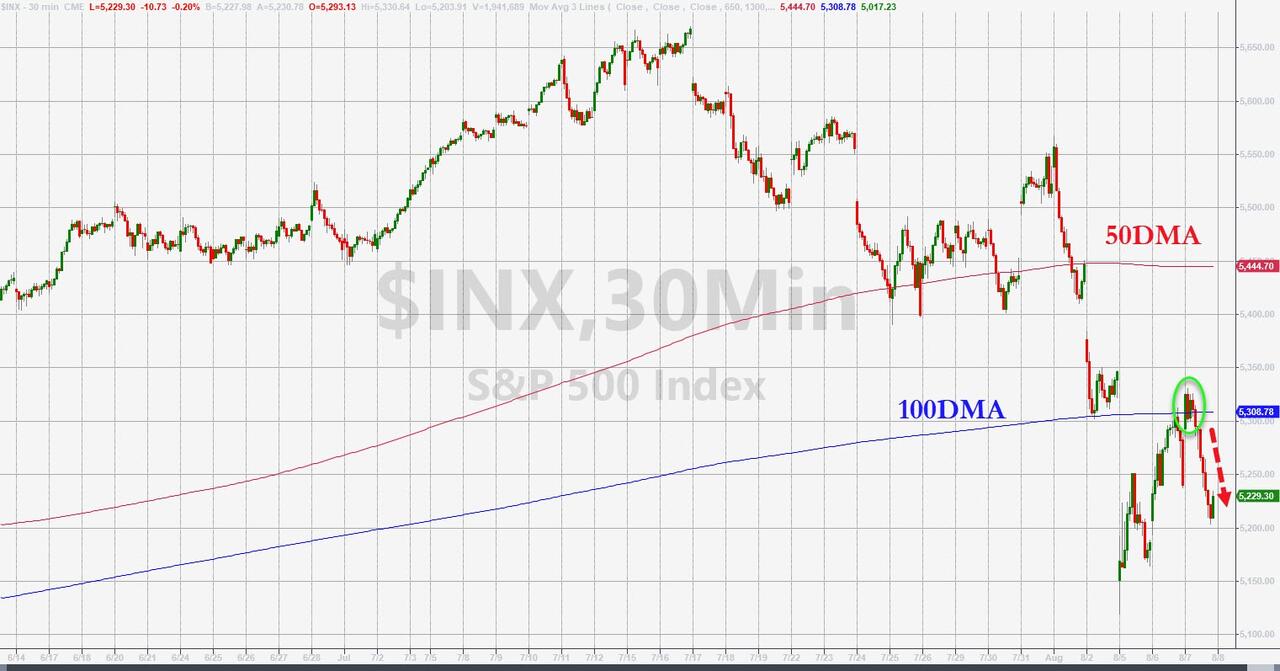
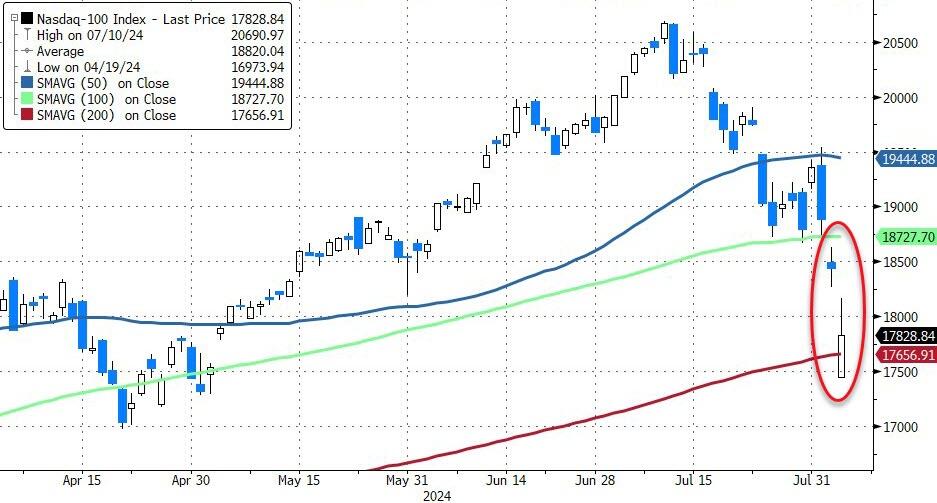
Key support levels were breached, with the S&P 500 testing its 100-day moving average but falling below it as bearish sentiment prevailed. The index remains 3.65% away from its 200-day moving average, and if this level is breached, it could signal the end of the bull market.
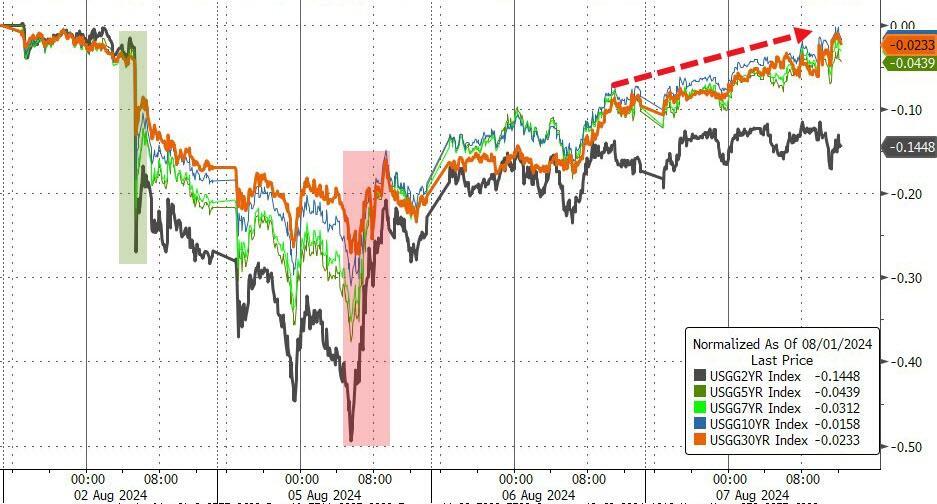
Bond yields rose following a disappointing 10-year auction, with the 10-year yield hovering around 4%. Rate-cut expectations for 2024 remained flat, crude oil prices rallied, and the dollar saw moderate gains.
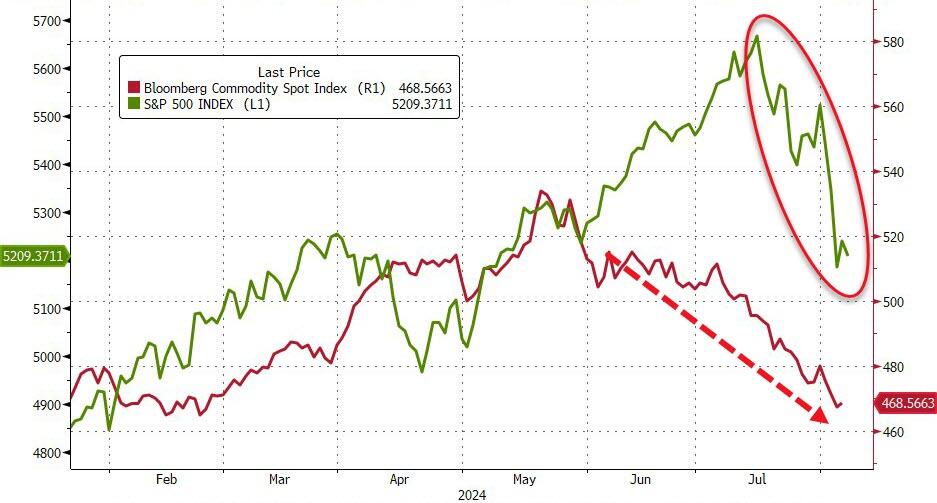
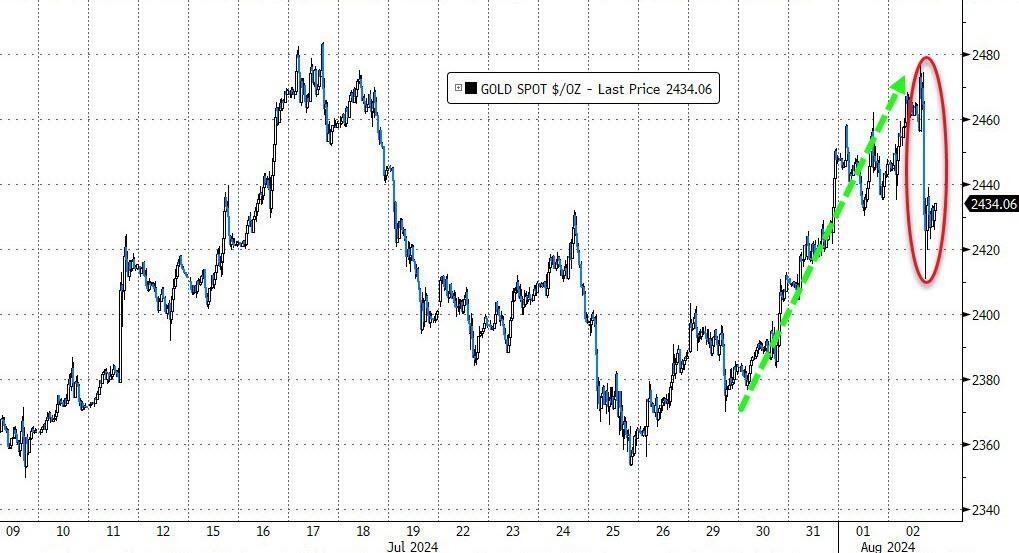
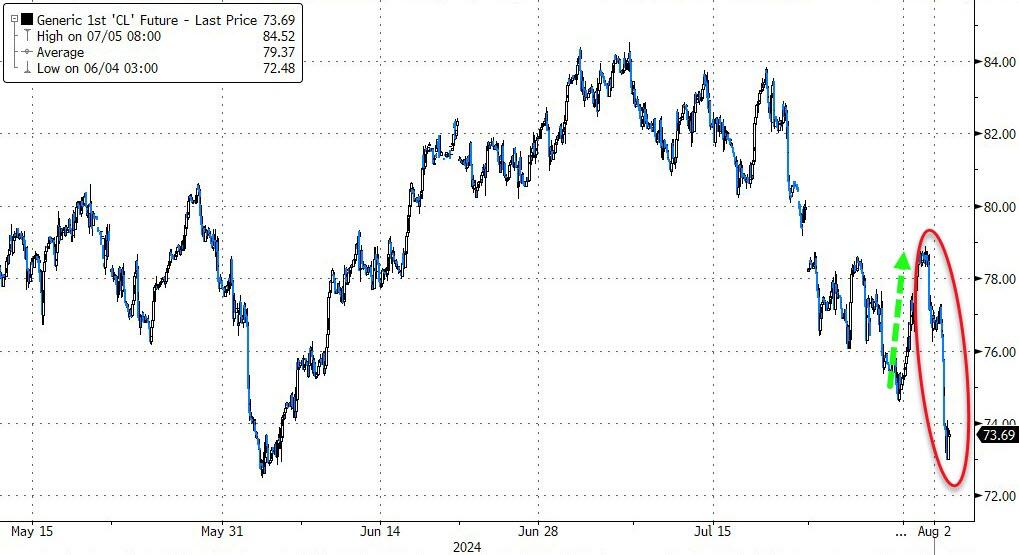
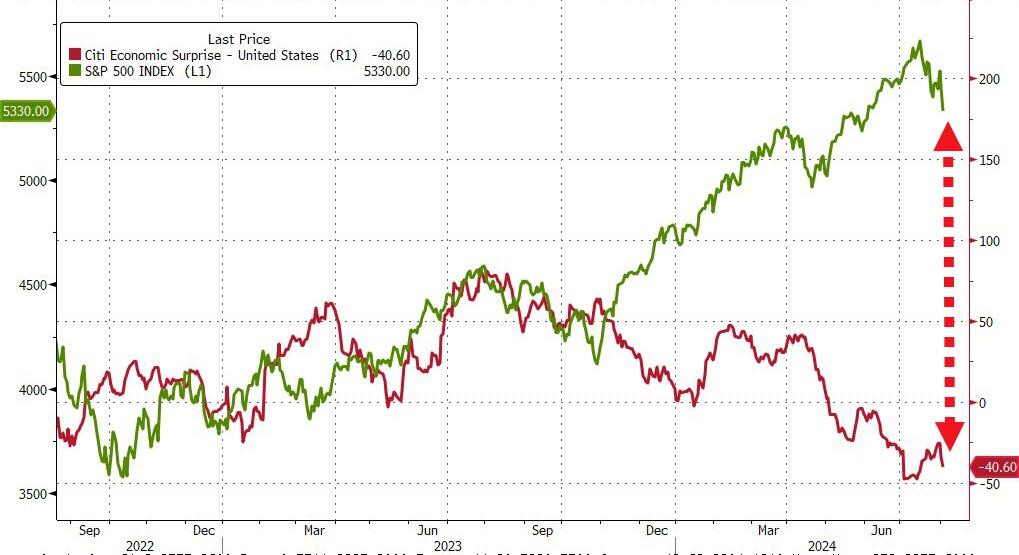
Gold dipped slightly, while Bitcoin surged towards the $58,000 level but failed to reach it and subsequently reversed. Commodity prices have been declining, which, according to this chart, has dragged down equities.
Is this a warning sign of what’s to come?
Continue reading…
2. Current “Buy” Cycles (effective 11/21/2023)
Our Trend Tracking Indexes (TTIs) have both crossed their trend lines with enough strength to trigger new “Buy” signals. That means, Tuesday, 11/21/2023, was the official date for these signals.
If you want to follow our strategy, you should first decide how much you want to invest based on your risk tolerance (percentage of allocation). Then, you should check my Thursday StatSheet and Saturday’s “ETFs on the Cutline” report for suitable ETFs to buy.
3. Trend Tracking Indexes (TTIs)
Wall Street underwent a dramatic shift in fortunes as an early rally abruptly reversed course, leading to a disappointing close with major indexes ending in the red.
Traders were caught off guard by this sudden downturn.
Our TTIs presented a mixed scenario: while the International TTI showed a slight gain, the Domestic TTI edged closer to a critical threshold that could soon trigger a “Sell” signal. If you are tracking these developments, it’s essential to stay tuned for the latest updates.
This is how we closed 08/07/2024:
Domestic TTI: +1.72% above its M/A (prior close +2.44%)—Buy signal effective 11/21/2023.
International TTI: +0.81% below its M/A (prior close +0.26%)—Buy signal effective 11/21/2023.
All linked charts above are courtesy of Bloomberg via ZeroHedge.
———————————————————-
WOULD YOU LIKE TO HAVE YOUR INVESTMENTS PROFESSIONALLY MANAGED?
Do you have the time to follow our investment plans yourself? If you are a busy professional who would like to have his portfolio managed using our methodology, please contact me directly to get more details.
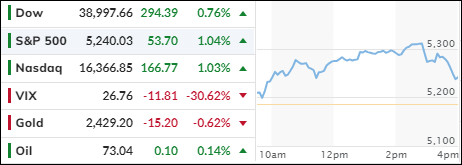
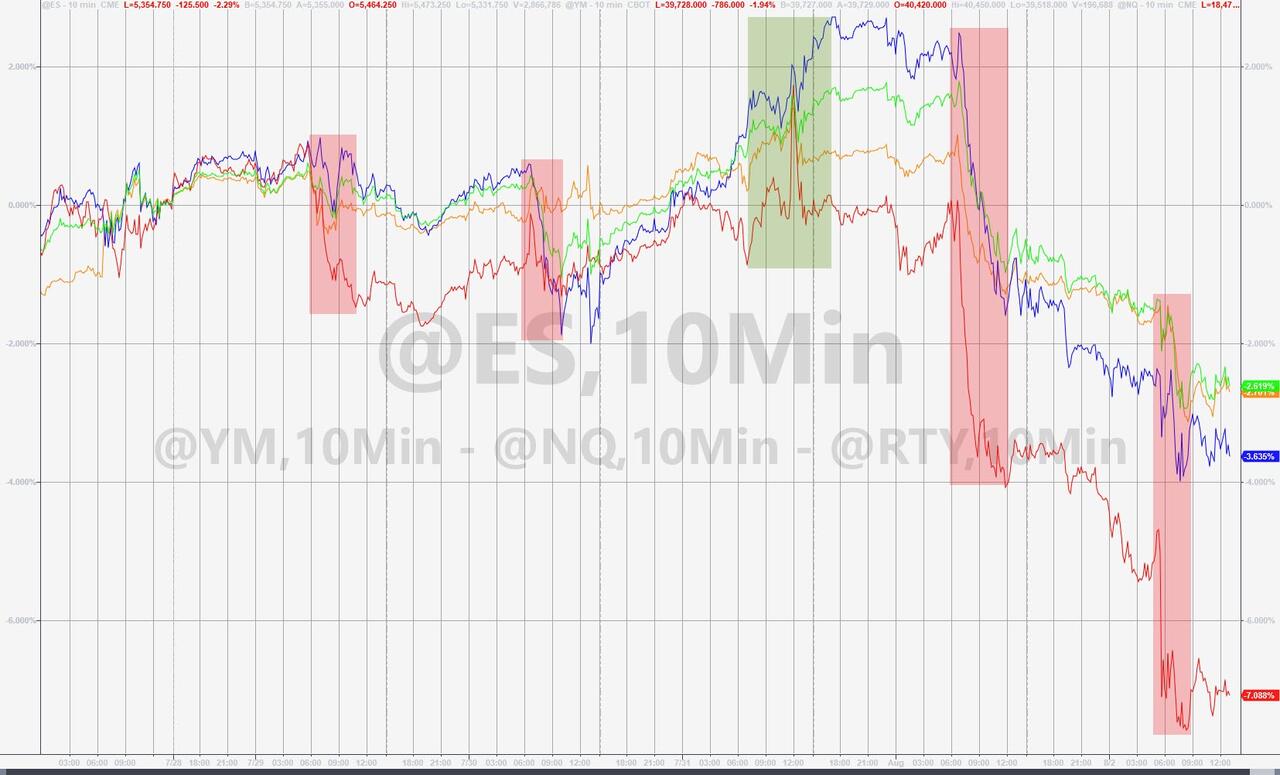
After the intense selling pressure during the first three trading days of August, which drove the S&P 500 down by over 6%, equities rebounded today, recovering some of their losses. Whether this marks the end of the downturn or is merely a relief bounce remains uncertain.
The tech sector also saw a recovery, with major players like Nvidia and Meta advancing, although Apple continued to show weakness, losing 1%. Contributing to the renewed bullish sentiment was a rebound in Japanese stocks, following the Nikkei index’s worst day since the 1987 crash.
Volatility is likely to remain high, and this correction may be far from over. Concerns about the state of the economy persist, and the Japanese carry trade is still unwinding. This could lead to further market pressure in the coming weeks, with ongoing worries about inflation, debt, and deficits adding to the uncertainty.
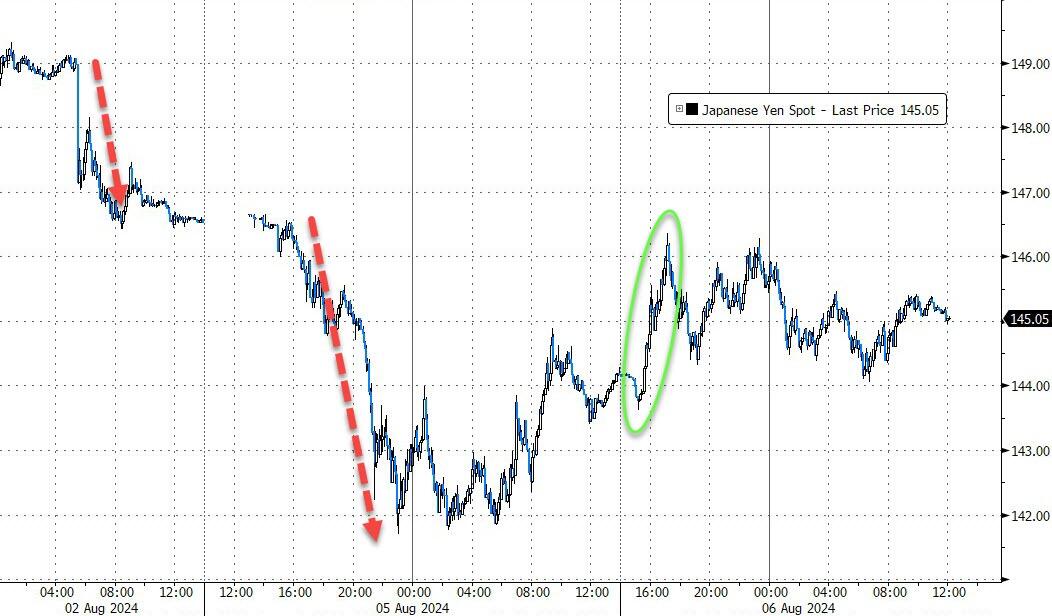
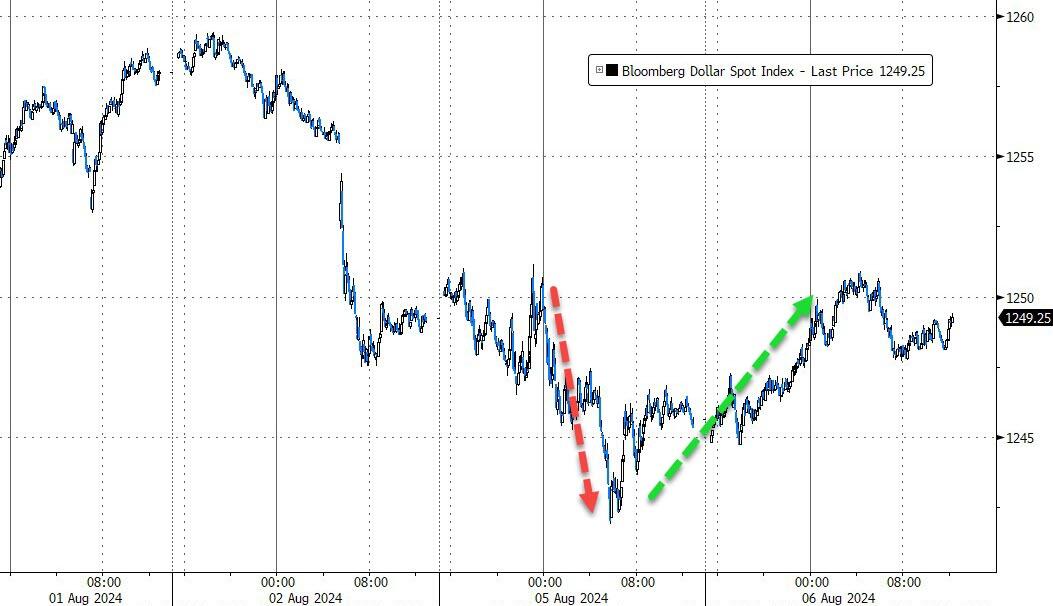
Given these circumstances, reducing exposure to more volatile sectors in favor of less volatile ones seems prudent. The Japanese Yen continued its rebound from yesterday’s lows, prompting speculation that the Bank of Japan may have quietly intervened to provide support.
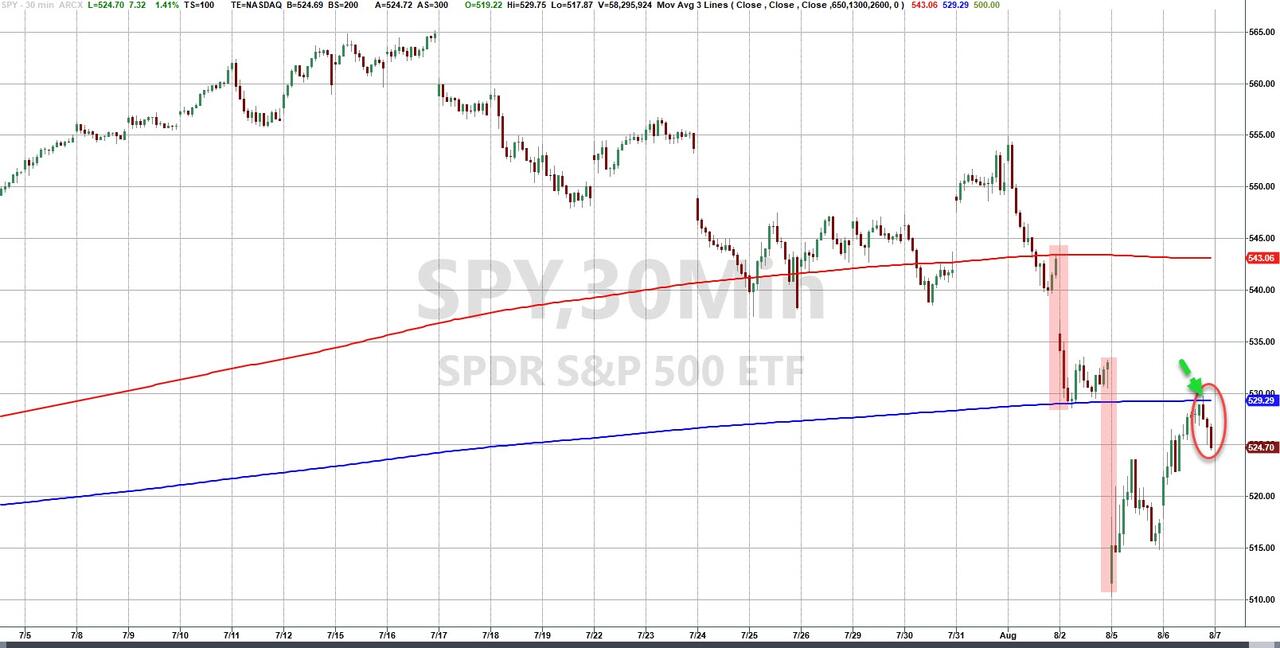
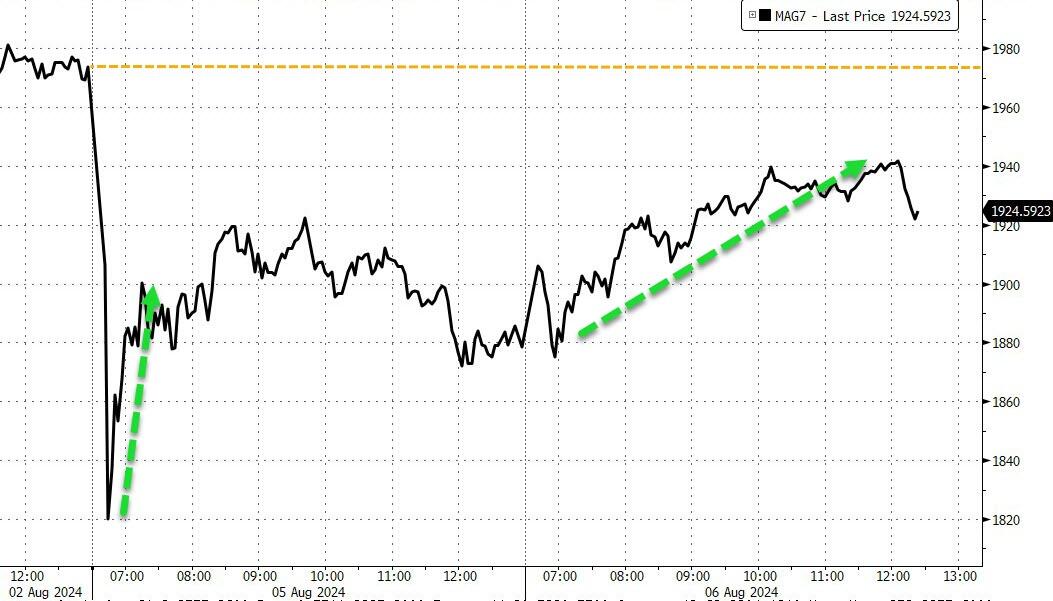
This turnaround Tuesday also benefited the major indexes, with the S&P 500 receiving a boost from algorithms that lifted the index to its 100-day moving average, only to reverse direction at that level.
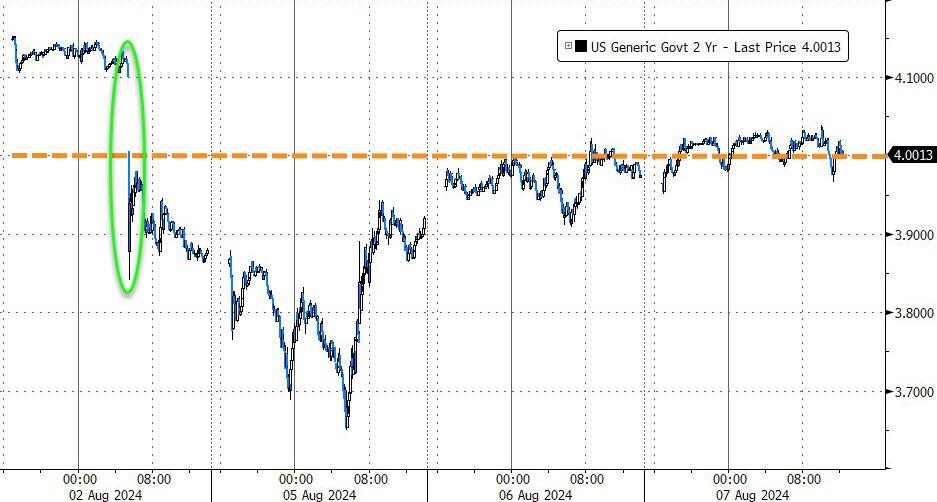
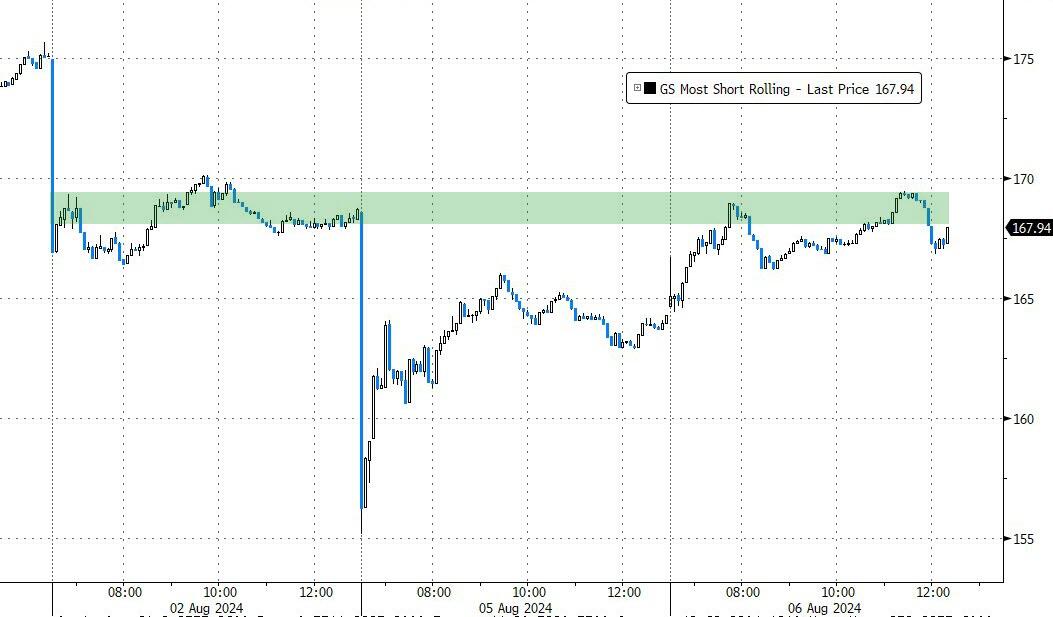
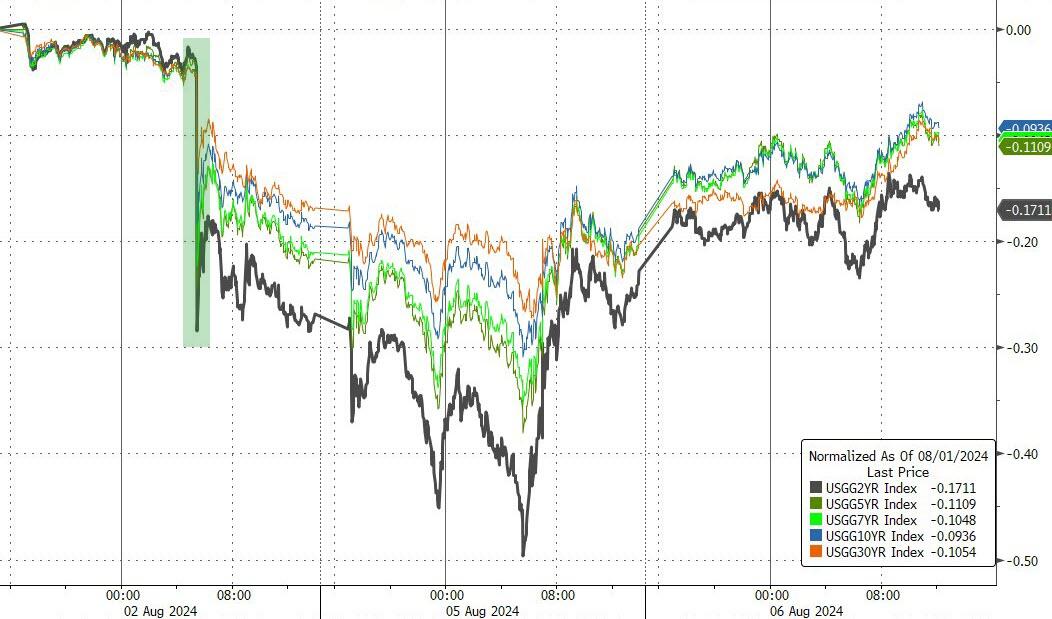
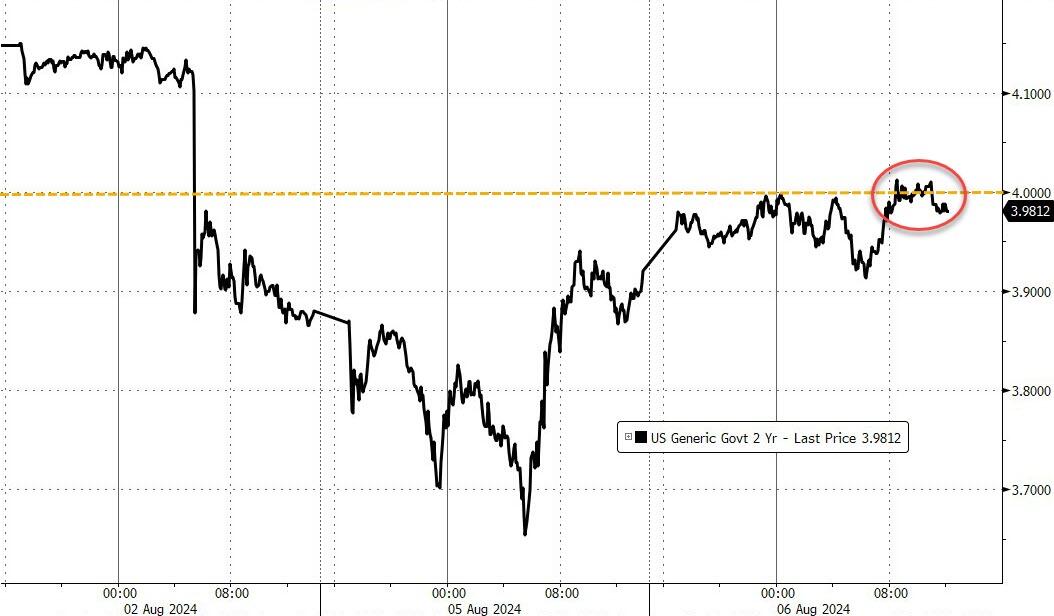
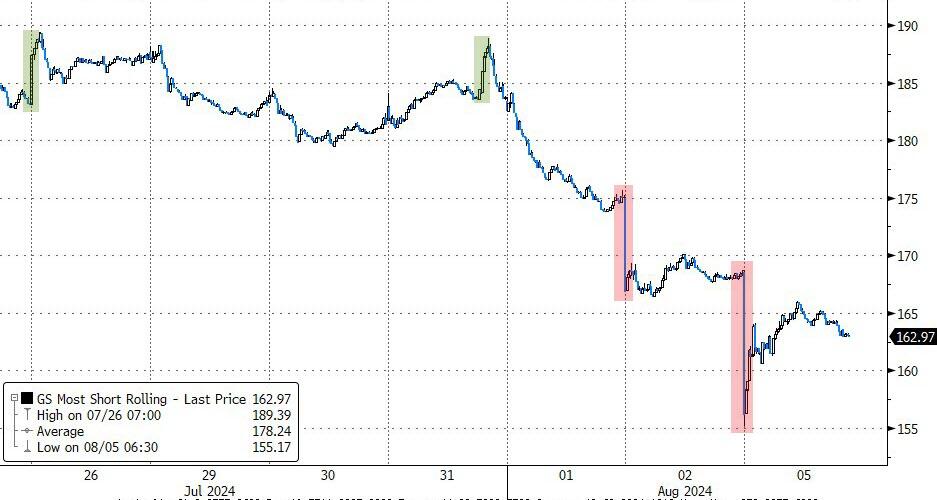
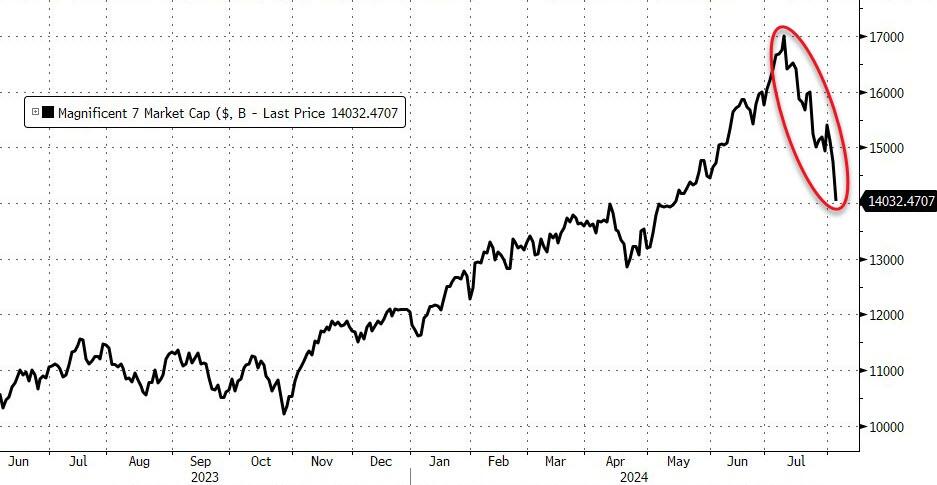
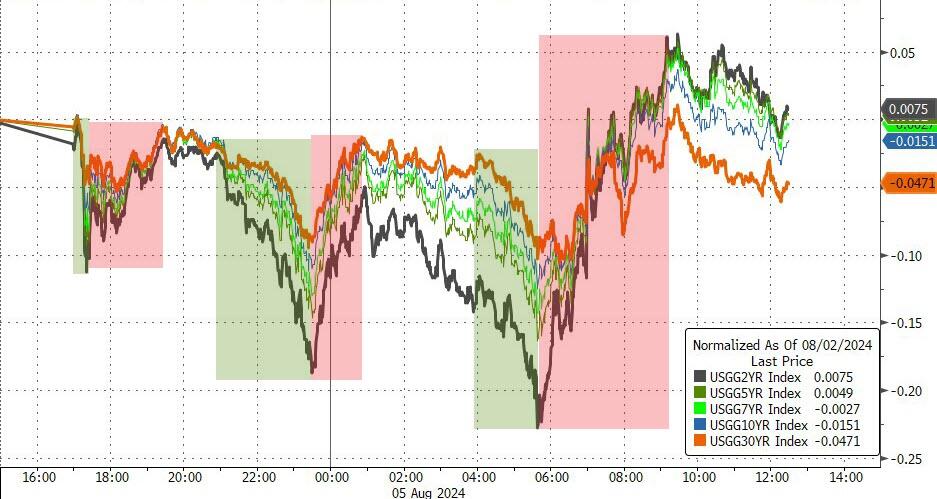
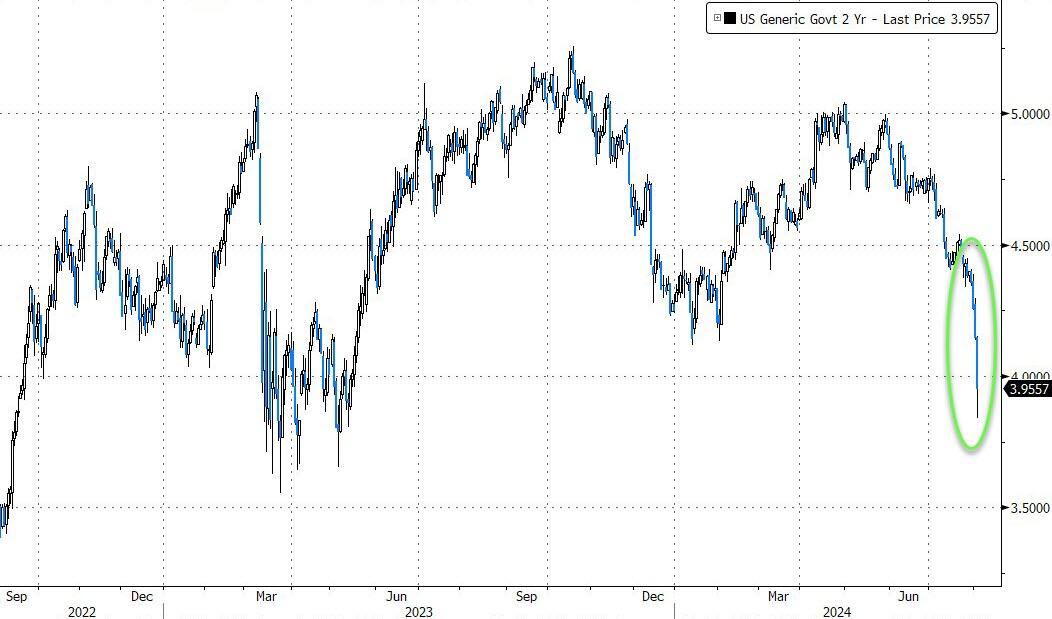
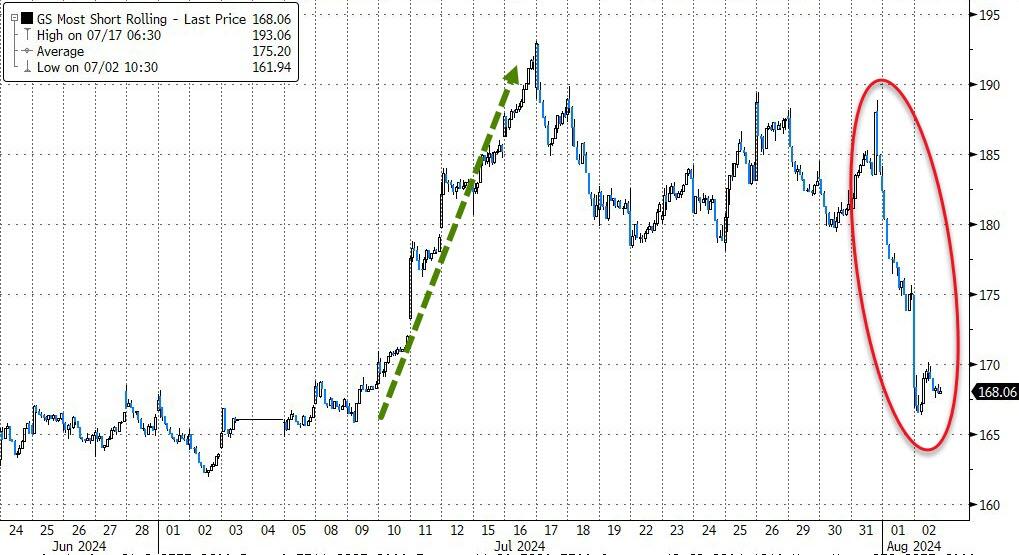
The most shorted stocks experienced a squeeze but encountered overhead resistance. The MAG7 basket made a comeback but fell short of reaching yesterday’s starting point. Bond yields rallied, with the 2-year yield testing the 4% level again.
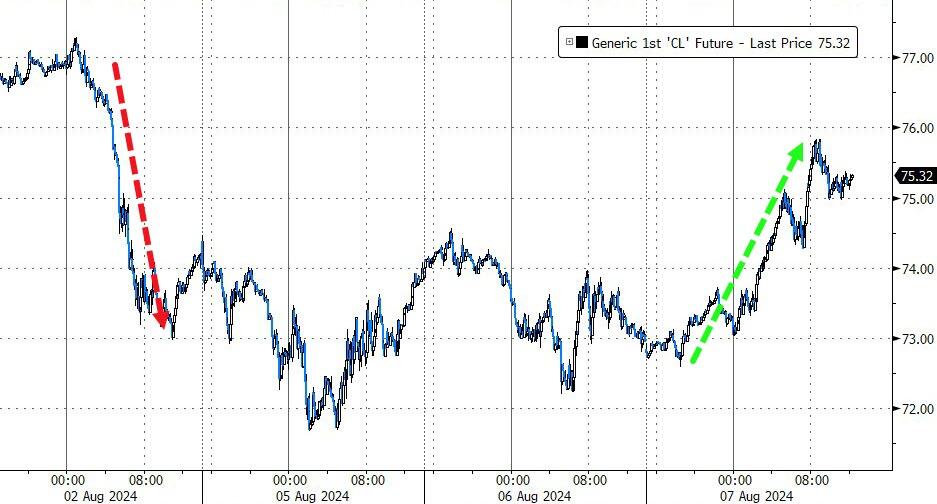
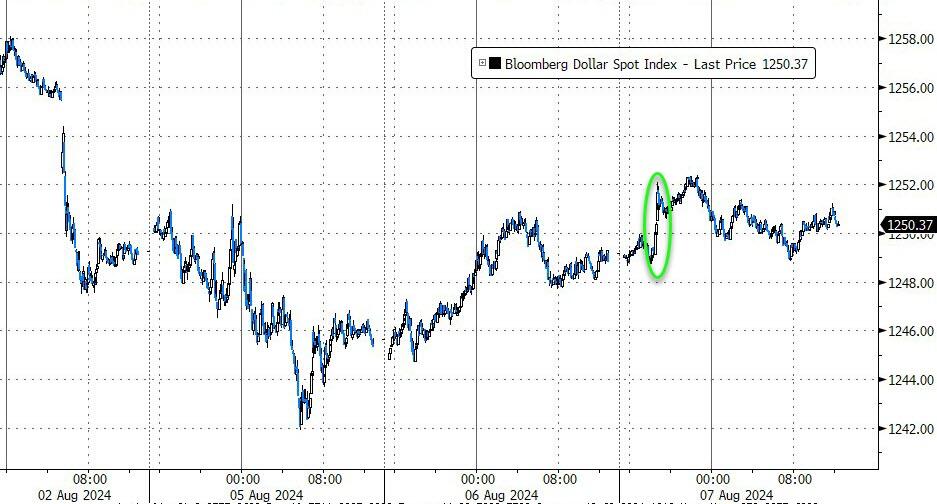
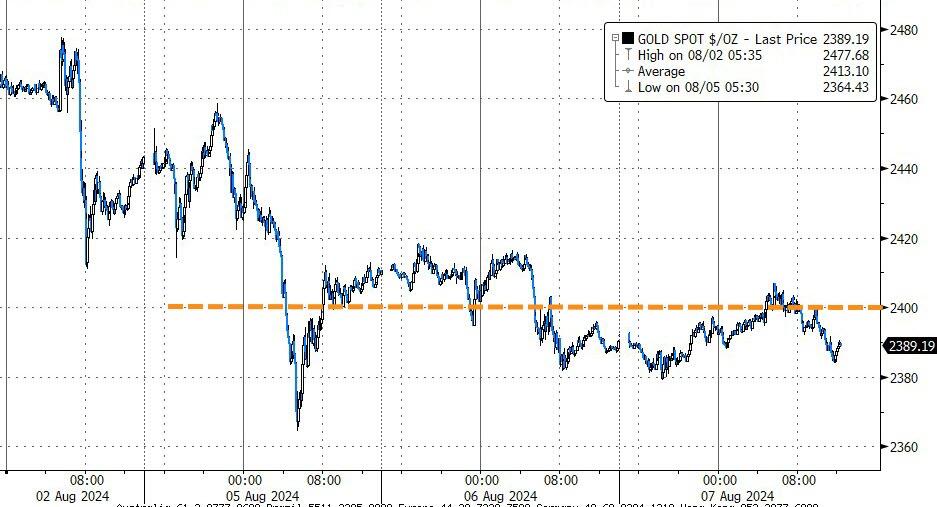
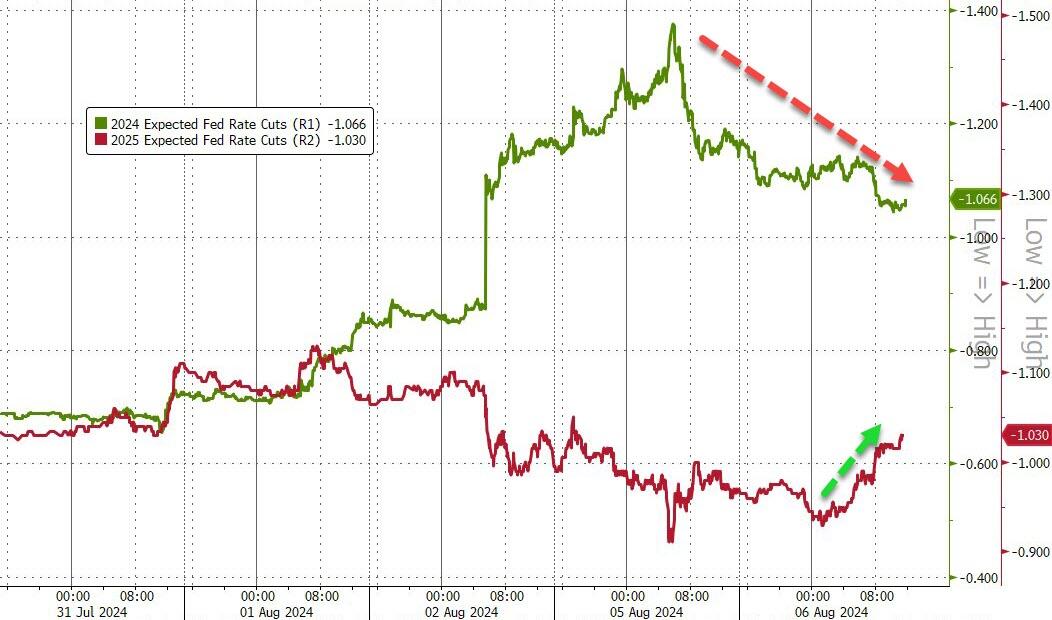
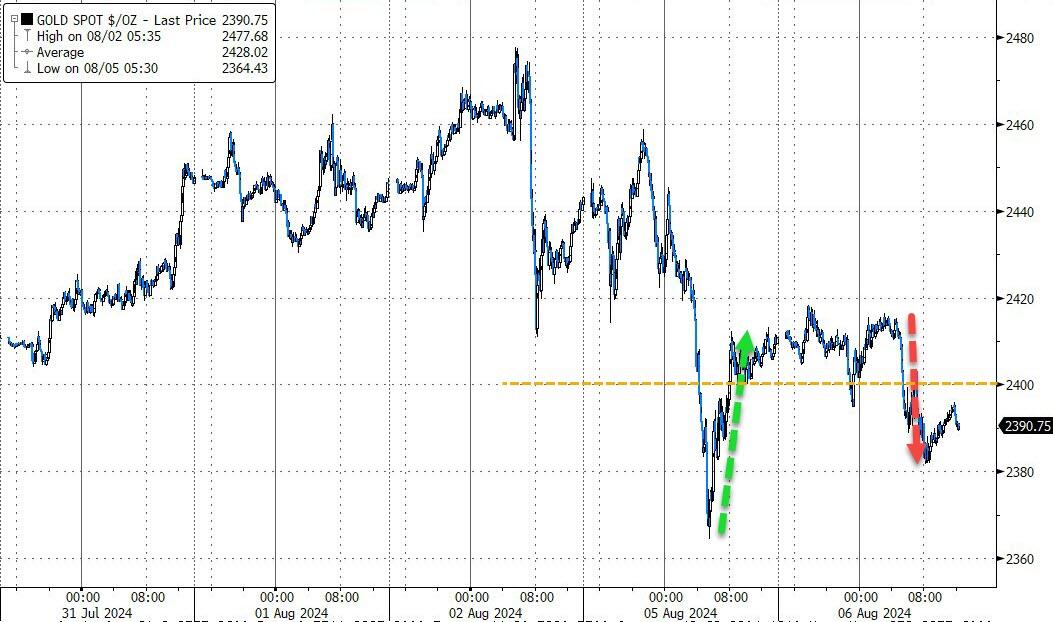
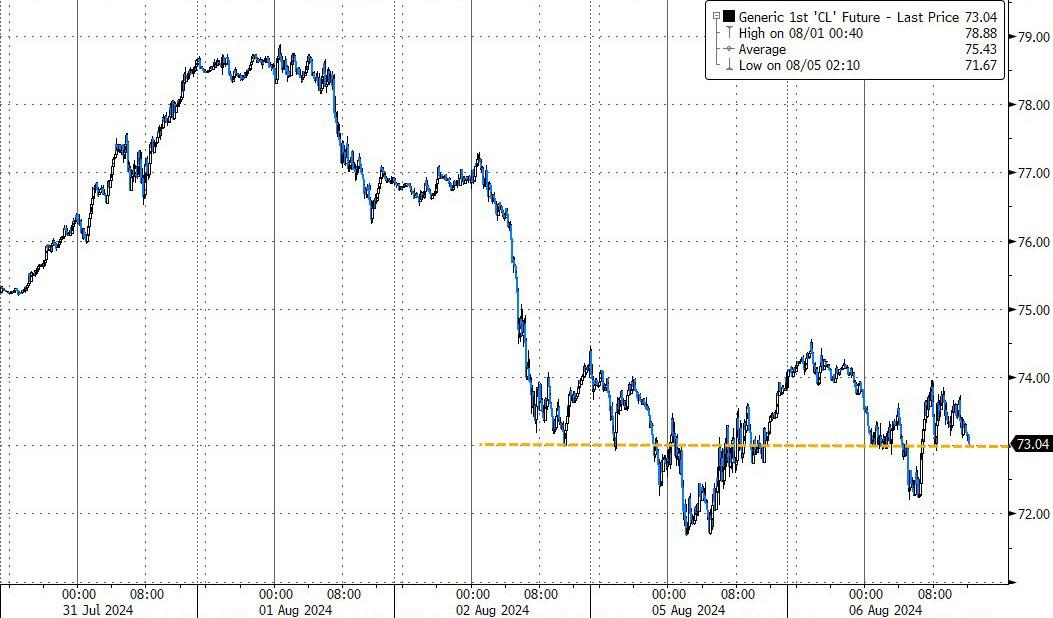
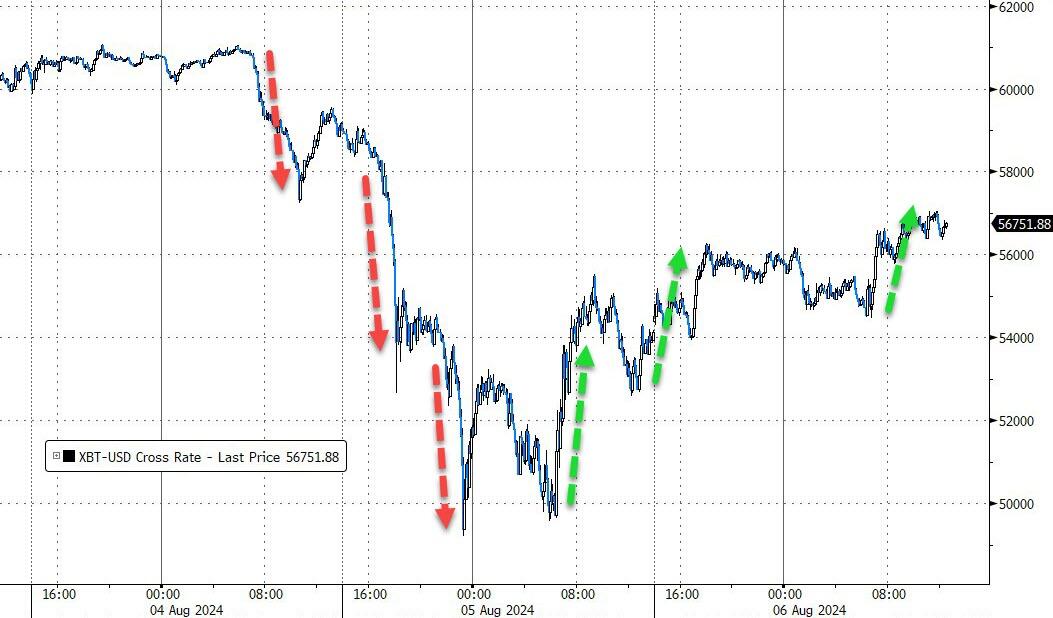
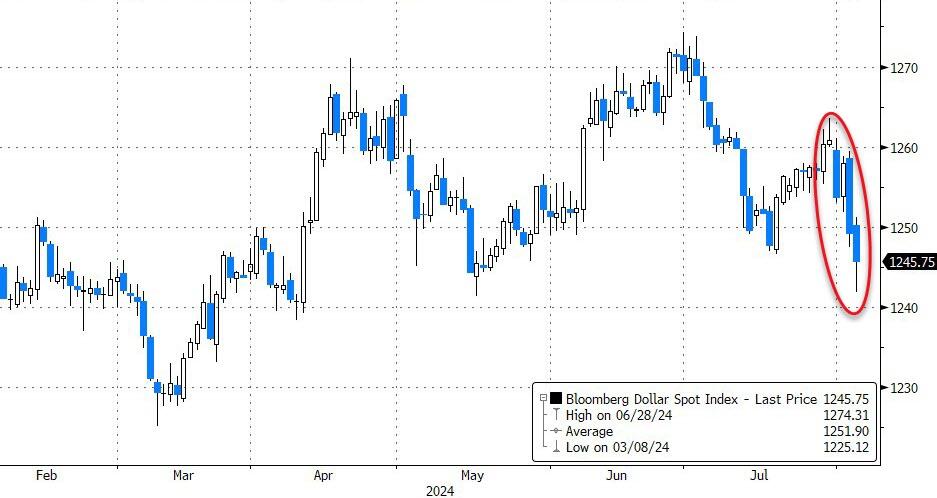
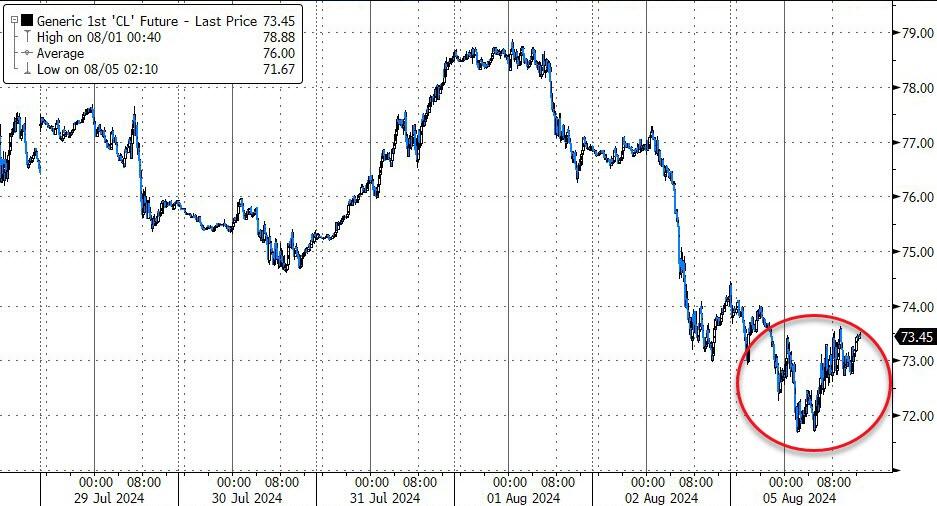
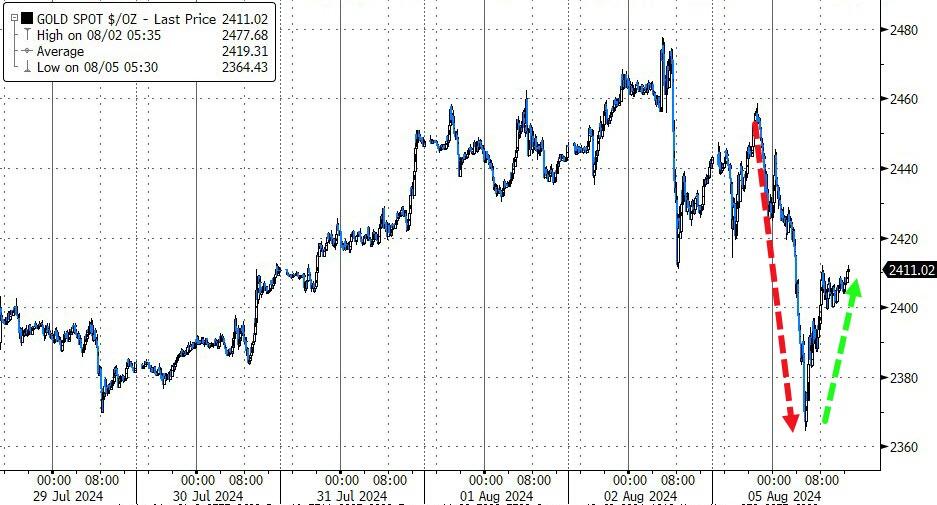
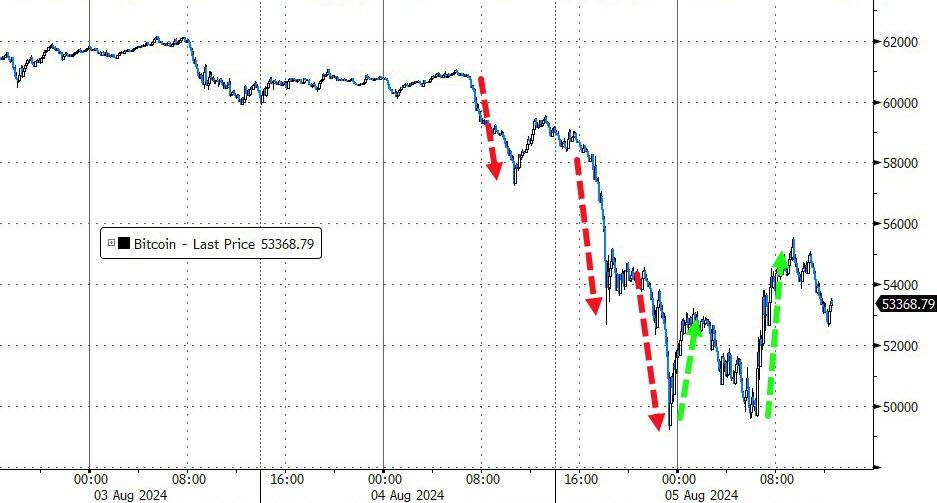
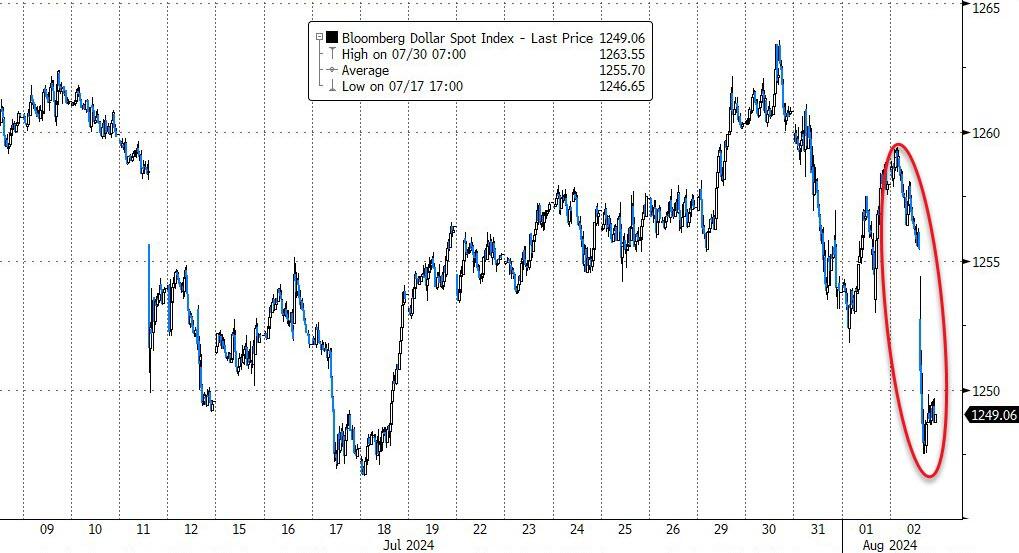
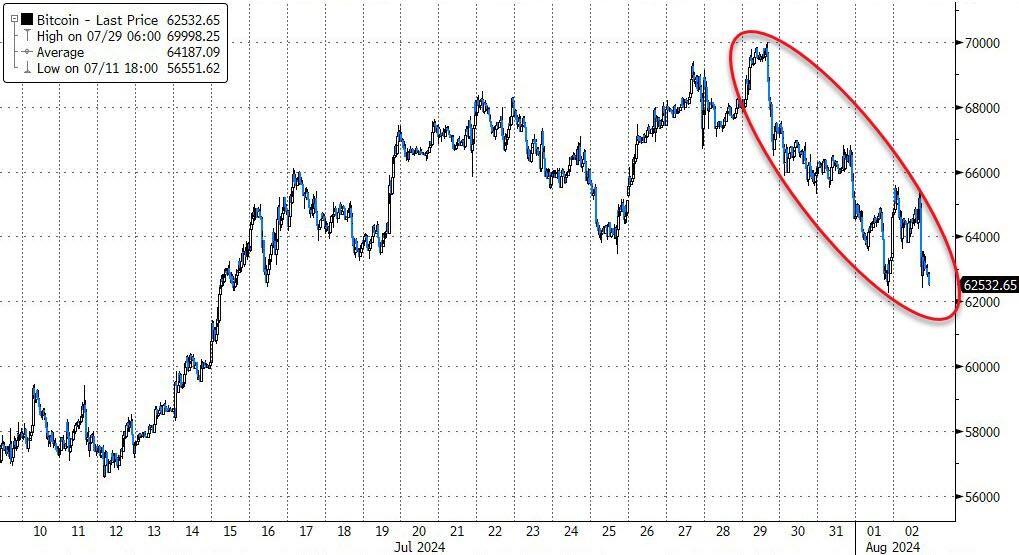
Meanwhile, rate-cut expectations dropped, the dollar staged a comeback, and gold temporarily surrendered its $2,400 level. Crude oil slipped, but Bitcoin bounced higher, testing its $57k level and advancing by 6%.
Bloomberg summed up an old cliché about turnaround Tuesdays:
“The bad news is such recoveries don’t guarantee a bottom has been reached.”
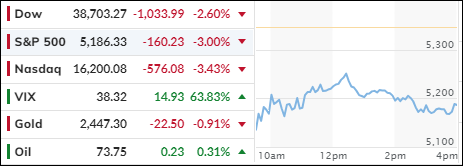
Last week’s selloff spread globally and accelerated this morning as traders grappled with fears of a U.S. recession. The downturn began in Japan, where the Nikkei plummeted over 12%, marking its worst day since the 1987 Black Monday crash. Contributing to the turmoil was Japan’s recent decision to hike interest rates, which disrupted the highly leveraged yen carry trade and triggered a cascade of selling and forced liquidations worldwide.
In the U.S., the Dow Jones Industrial Average dropped over 1,000 points, or 2.6%, while the Nasdaq fared even worse, losing 3.4%. The release of July’s jobs report on Friday exacerbated the situation, convincing traders that the Federal Reserve is behind the curve in cutting rates to address the current economic slowdown.
Mega-cap tech stocks were hit hardest, with Nvidia falling 6%, Apple 5%, and Tesla 4%. Broadcom and Super Micro also declined by 1% and 2.5%, respectively. Notably, only nine stocks in the S&P 500 ended the session higher.
At their lowest points, Small Caps and the Nasdaq were down 6% before dip buyers stepped in to limit the damage. The most shorted stocks were heavily impacted but managed to recover some ground late in the session.
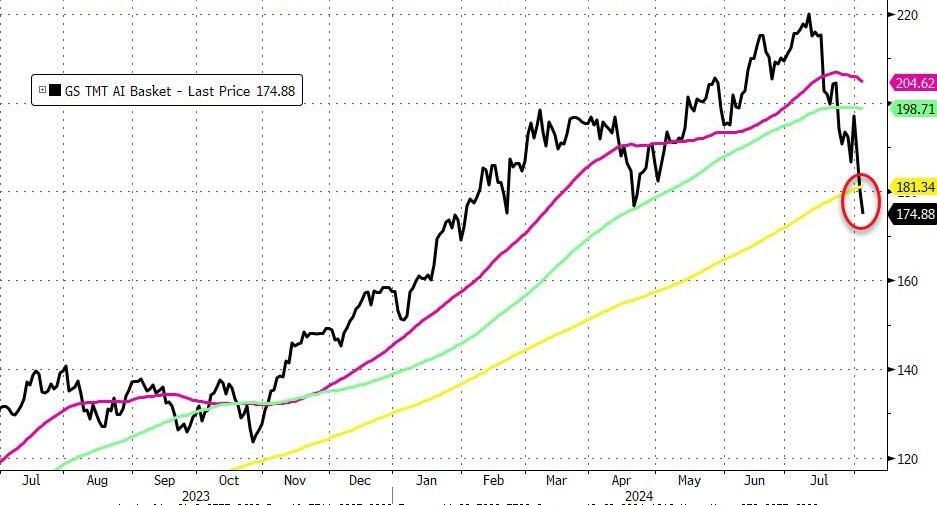
The MAG7 stocks suffered significant losses, now down an astonishing $3 trillion from their record highs. The AI sector also faced a rapid decline, falling below its 200-day moving average. Bond yields were volatile, initially collapsing before rebounding to nearly unchanged levels.
The dollar weakened, crude oil retreated but later recovered, and gold experienced wild swings before bouncing off support. Bitcoin also took a dive as traders liquidate assets to meet margin calls, but it found support at the $50,000 level.
In my advisory practice, we sold a major tech ETF and closed our position in the international market after the International TTI dropped below its long-term trend line.
The future direction of the market now hinges on the Federal Reserve’s response.
Will they panic and implement an emergency rate cut to prevent equities from plunging further?
Do you want to know which ETFs are hot and which ones are not? Then you need my High-Volume ETF Cutline report. It tells you how close or far each of the 311 ETFs I follow is from its long-term trend line (39-week SMA). These are the ETFs that trade more than $5 million a day, so they are not some obscure funds that nobody cares about.
The report is split into two parts: The winners that are above their trend line (%M/A), and the losers that are below it. The yellow line is the line of shame that separates them. You can see how many ETFs are in each group and how they have changed since the last report (269 vs. 239 current).
STOCK MARKET FACES TURBULENCE: IS A RECESSION ON THE HORIZON?
[Chart courtesy of MarketWatch.com]
Moving the market
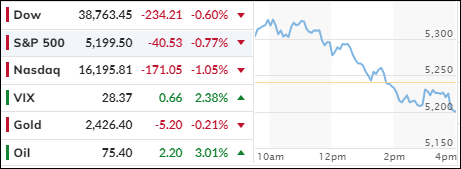
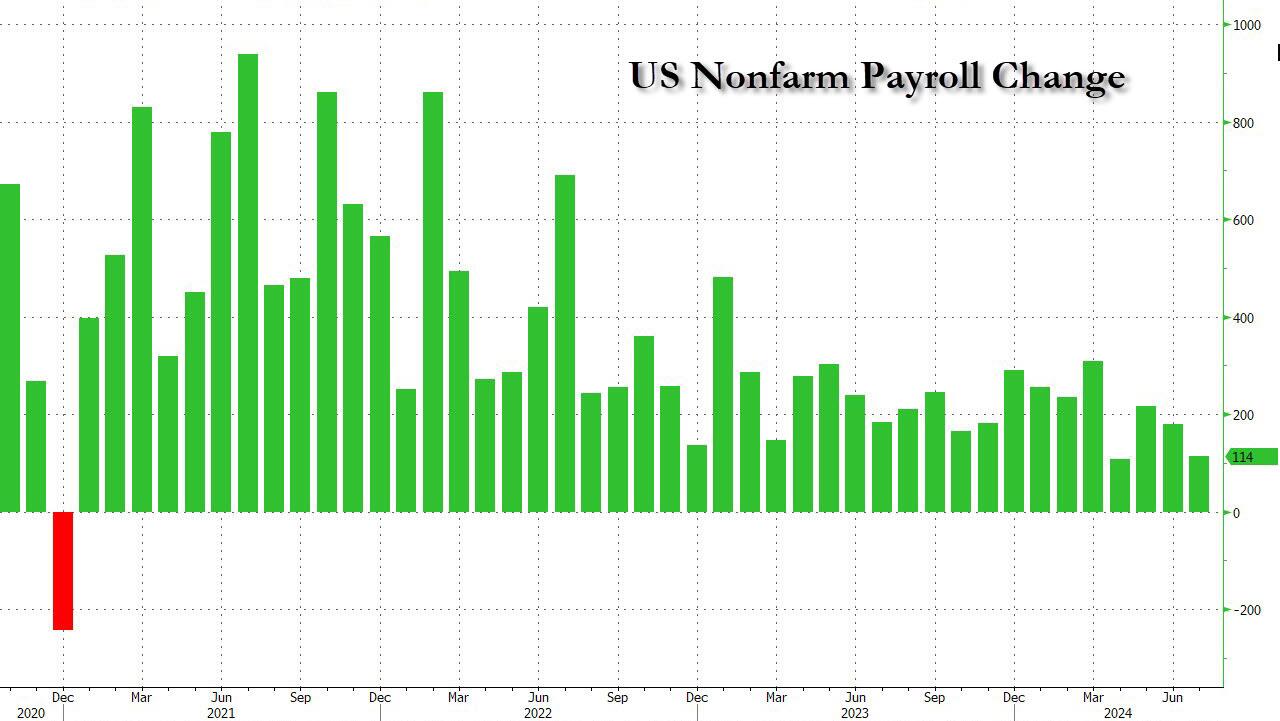
The markets suffered a significant downturn this morning, driven by a weaker-than-expected July jobs report that dampened any bullish sentiment. Nonfarm payroll jobs increased by only 114,000 last month, a sharp decline from the 179,000 jobs added in June and well below the expected 185,000 gain. Adding to the market’s woes, the unemployment rate rose to 4.3%.
Further exacerbating the situation, Amazon missed its second-quarter revenue targets and issued a disappointing outlook, causing its stock to plummet by 9%. Intel fared even worse, with its stock price dropping by 26% following weak guidance and announcements of layoffs. Apple saw a slight decline, while Nvidia fell by 2% after a 6% drop the previous day. The looming threat of a recession became more pronounced, impacting stocks most vulnerable to economic downturns.
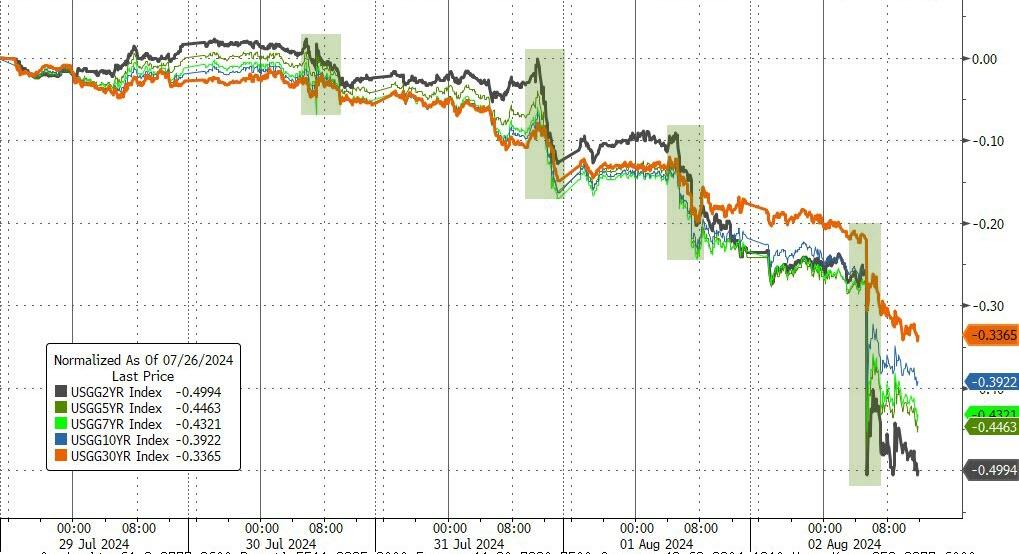
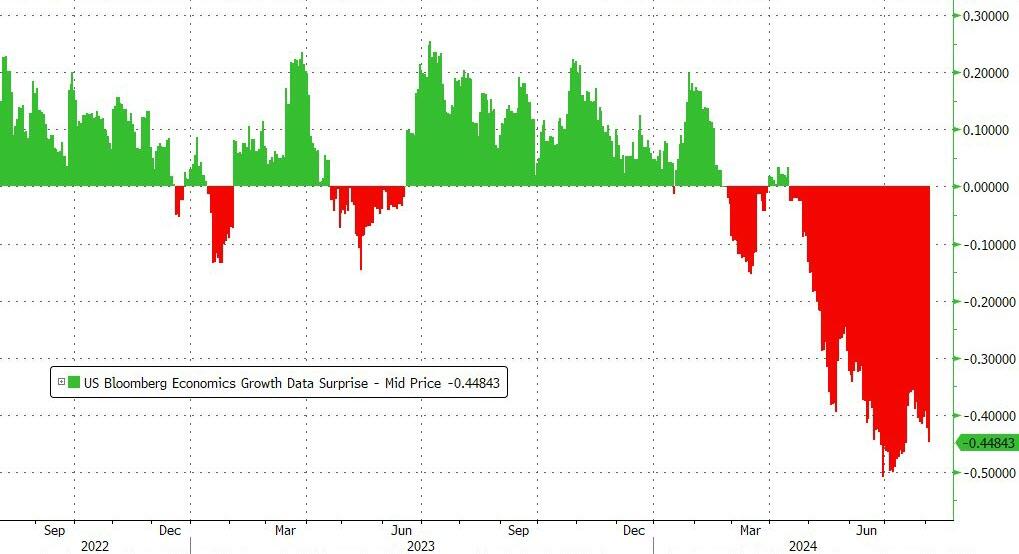
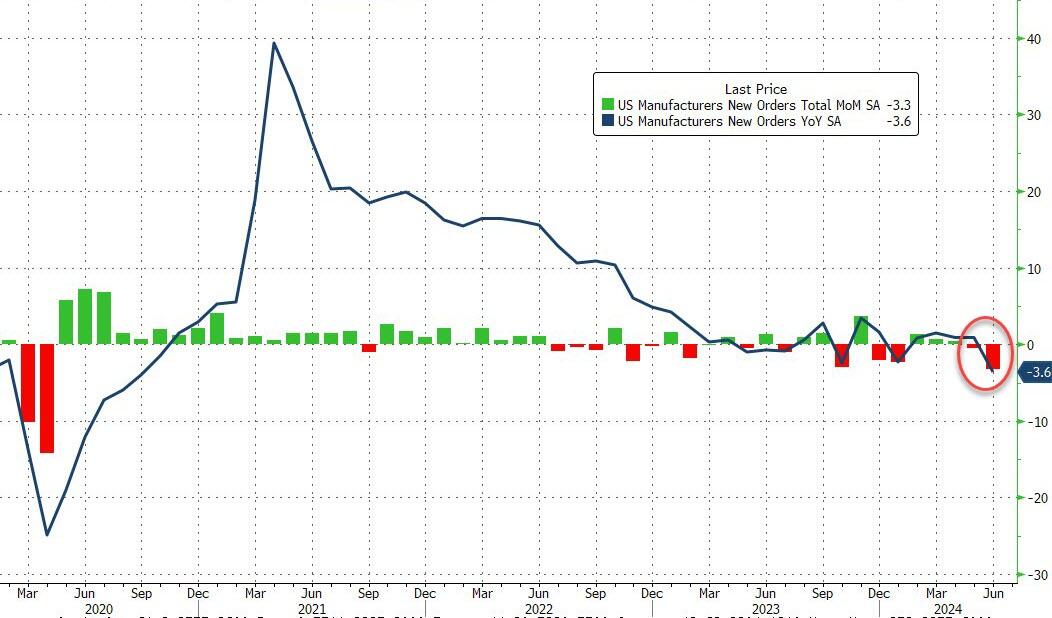
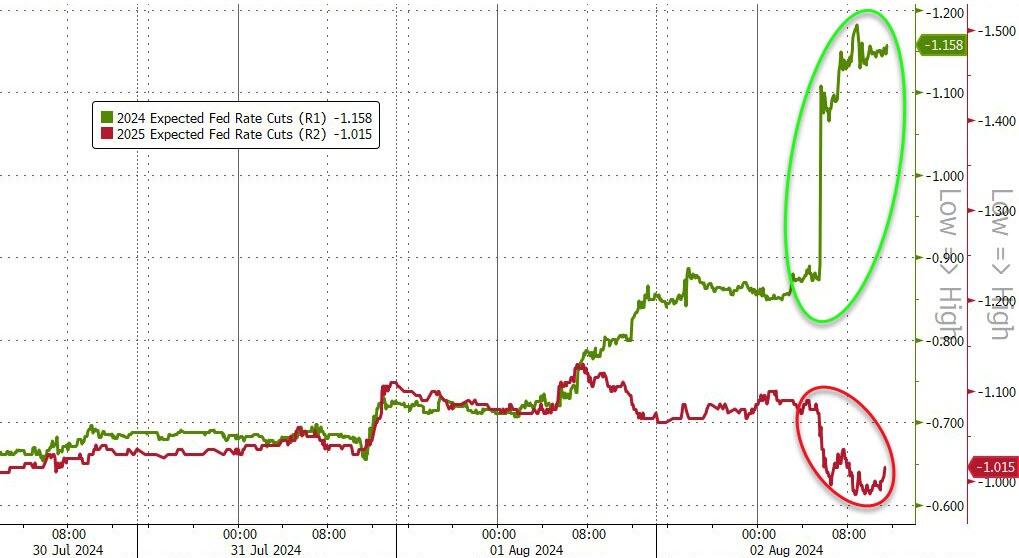
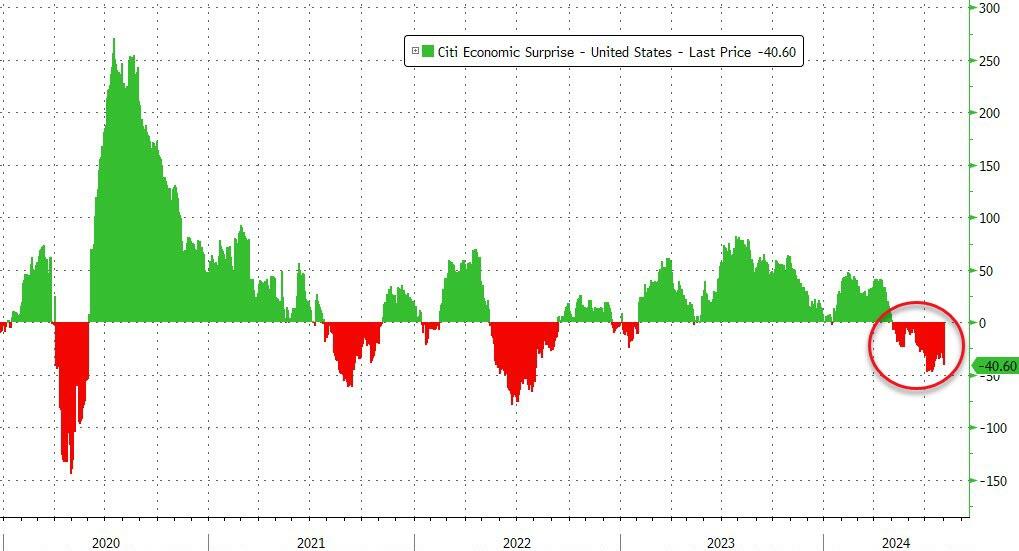
Bond yields fell sharply, with the 2-year yield dropping below 4% as investors sought safety. The market narrative shifted back to “bad is bad and good is good,” with growth concerns intensifying due to a 3.3% month-over-month decline in factory orders. Consequently, rate-cut expectations surged, with traders now anticipating four cuts for the remainder of 2024. The Citi Economic Index also declined, heightening growth fears among traders.
Throughout the week, heavily shorted stocks faced significant pressure, the dollar approached July’s lows, Bitcoin struggled but found support at the $62,000 level, and gold managed a weekly gain despite today’s decline. Crude oil prices fell to two-month lows amid rising tensions in the Middle East.
Reflecting on the broader picture, I am left with two key questions:
1. Is this week the beginning of a downward trend in stock prices, aligning with economic realities?
2. Is the Federal Reserve too late in adjusting its monetary policy?

