
- Moving the market
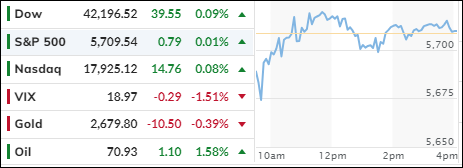
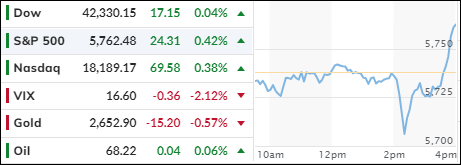
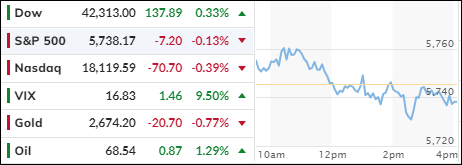
The markets began the second day of October in negative territory, driven by escalating tensions in the Middle East. Despite this, the markets closed relatively unchanged, with China’s recent upward trend continuing, bolstered by their substantial stimulus program.
Nike experienced a significant 7% drop after canceling its full-year guidance ahead of a new CEO’s arrival. Meanwhile, the tech sector lacked direction, with Tesla shares falling over 4% due to disappointing delivery numbers.
Traders currently view these geopolitical tensions as a temporary disruption. However, the potential economic impact could be more severe, especially as the effects of the East Coast port strike become apparent.
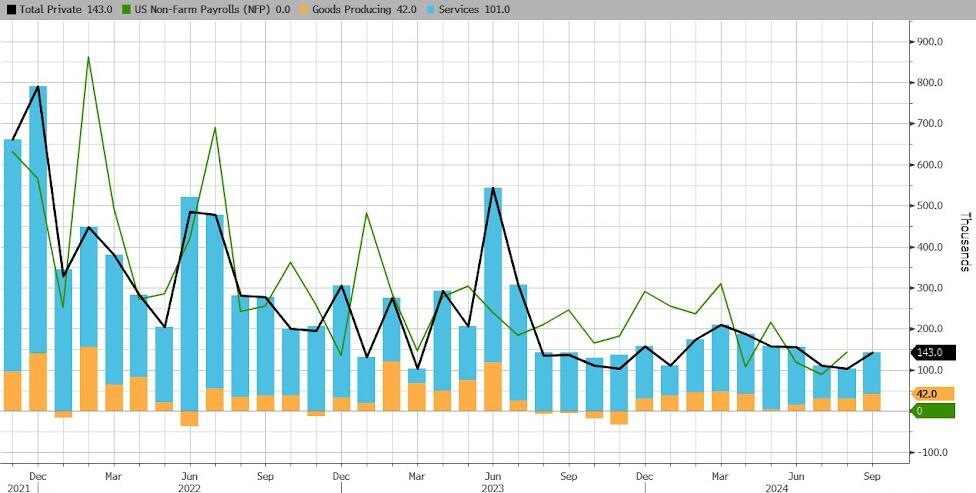
On a positive note, ADP data revealed better-than-expected private payroll growth last month, with 143,000 new jobs created compared to the anticipated 125,000. However, this does not guarantee that Friday’s nonfarm payroll report will follow the same trend. The upcoming report could significantly influence the market’s direction and the Federal Reserve’s next interest rate decision.
The MAG7 basket initially slipped but managed to recover, cutting its early losses as bond yields rose. This increase supported the dollar but negatively impacted gold and Bitcoin, with the latter experiencing a more substantial decline.
Crude oil prices fluctuated after yesterday’s rally, as Middle East tensions remained high. Although it was a quiet day in the markets, this could quickly change with the release of the payroll numbers on Friday.
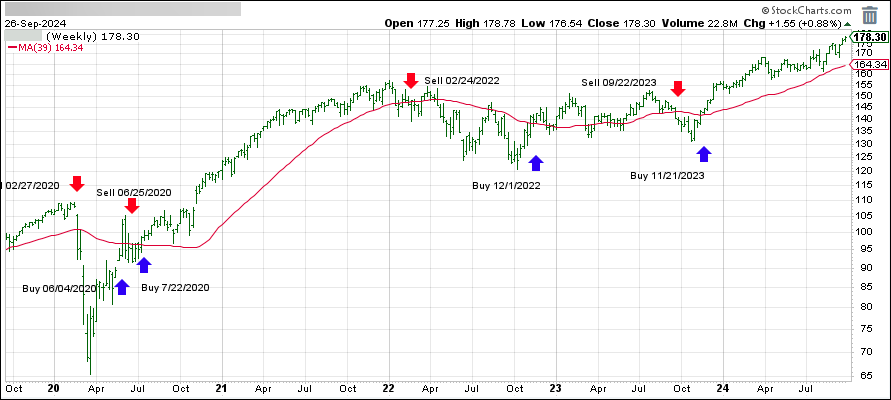
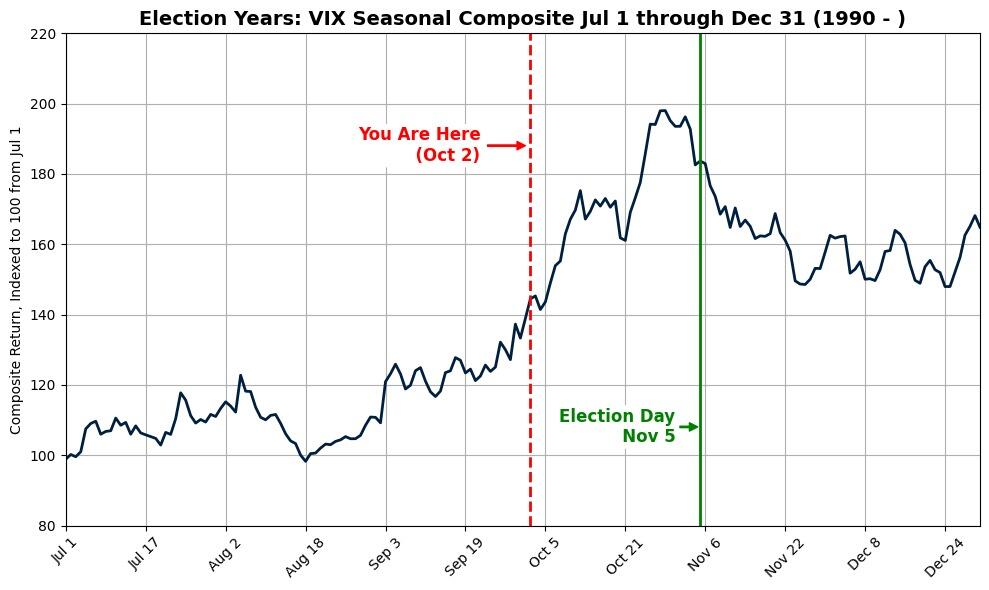
Seasonally, we have entered one of the most volatile periods of the year, with the VIX likely to increase significantly, as indicated in this chart.
Read More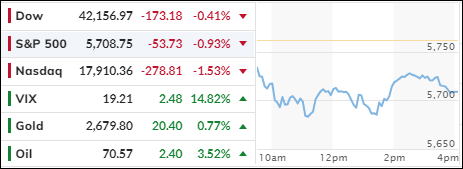
