The ETF/No Load Fund Tracker
Monthly Review—May 31, 2013
US Equities Finish May With A Whimper; Europe Rises For The 12th Month
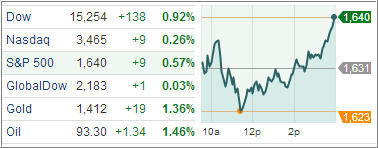
US equity indexes finished higher in May with the S&P 500 index clocking its longest winning streak since September 2009 despite a sharp pullback on the last trading day of the month. Wall Street closed another month of gains on a somber note as mixed economic reports took some of the sheen off of an otherwise robust May.
The blue-chip Dow Jones Industrial Average finished the month 1.9 percent higher. The S&P 500 added 2.1 percent while the tech-heavy NASDAQ Composite jumped 3.8 percent for the month.
Financials performed the best among all the business sectors in May, followed by industrials and technology. Healthcare slipped 2.2 percent, trimming its year-to-date gain to 20.1 percent. Although the markets didn’t witness the so-called ‘great rotation’ of funds out of bonds and into stocks, investors nevertheless, rotated money in and out of sectors in search of bargains.
Economic data for the month remained mixed. The Chicago Purchasing Managers’ Index jumped to its highest level since March 2012 with May’s reading coming at 58.7 following April’s disappointing print of 49. All the key subcomponents of the index, including order-backlogs, new orders, production and employment all notched up significant gains for the month.
Separately, the Thomson Reuters-University of Michigan consumer sentiment index ticked up to 84.5, the highest since July 2007. The housing market continued to improve as pending home sales rose 0.3 percent in April, a report by the National Association of Realtors showed.
Also, durable goods orders climbed 3.3 percent in April after declining 5.9 percent in March. Excluding transportation, durable goods demand rose 1.3 percent after declining 1.7 percent in March. Transportation orders surged 8.1 percent in April as defense and nondefense aircraft orders vaulted 25.7 percent in April.
On the flipside, a report by the Commerce Department showed the US economy grew less than expected last quarter. Gross domestic product expanded at an annual pace of 2.4 percent in the first three months, a touch lower from the initial estimate of 2.5 percent.
A separate report by the Commerce Department showed household purchases fell 0.2 percent in April following 0.1 percent in March. Incomes, however, remained unchanged.
Initial jobless claims rose more than expected in the final week of the May, spurring concerns of a slowdown in the labor market just when economists started to grow optimistic about the outlook.
Weak jobless and GDP numbers raised hopes the US Fed won’t taper its level of monthly bond purchases anytime soon. Also Ben Bernanke’s comment that premature tightening of monetary policy could stall the pace of recovery before the Joint Economic Committee on May 22 boosted investor sentiment.
Europe meanwhile continued to advance with the pan-European Stoxx Europe 600 index ticking higher for the 12th straight month.
Germany’s DAX 30 index rose 5.5 percent in May while France’s CAC 40 index added 2.4 percent for the month. UK’s FTSE 100 index picked up 2.4 percent for the month.
Unemployment, however, remained stubbornly high in the 17-member common currency zone with latest data showing jobless rate rising to 12.2 percent in April from 12.1 percent in the previous month.
Our main directional indicator, the Domestic Trend Tracking Index (TTI) remained solidly entrenched on the bullish side of the trend line (red) as the chart shows:
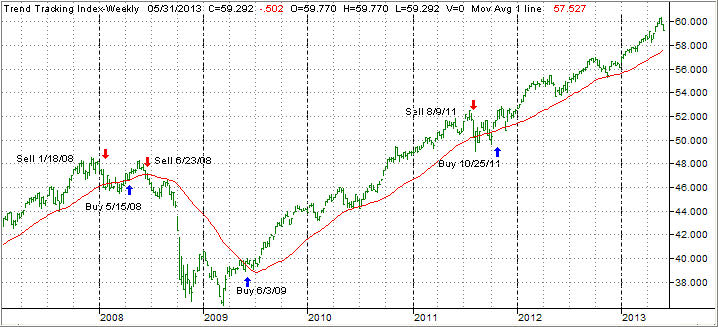
However, please note the reversal towards the end of the month (upper right) as the sell-off pulled this indicator off its lofty levels.
After a gangbuster April, things slowed down a bit during the second half of May, as our main holdings in the low volatility ETFs XLP and SPLV were not able to keep up their torrid pace from the previous months and gave back some of their gains. DVY held up better but still ended May in the red by -1.28%.
It sure was interesting to witness that these low volatility funds sold off faster than the major indexes. Usually, the opposite is the case, but since we are in unchartered territory, thanks to the Fed’s reckless monetary policies, nothing should come as a surprise.
To my way of thinking, low volatility weakness could signal that a major directional change is about to happen, kind of like being the proverbial canary in the coal mine, or, investors simply ditched conservative funds in favor of aggressive funds in anticipation of the bull market pushing the indexes to the next higher level.
Be that as it may, we will follow my existing theme of holding on until our trailing sell stops kick in and point us to the exit door. Anything else would be just pure guesswork.
In this uncertain environment where bad news is good news and good news is good news, while worse news is even better news, as far as bullish tendencies are concerned, we need to be disciplined, so we have some means of control in what seems like an out of control market environment.