1. Moving The Markets
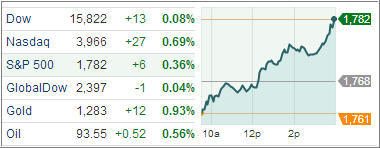
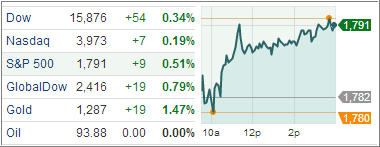
Major U.S. market indexes moved higher as Janet Yellen, likely to win confirmation for the top post at the Federal Reserve, said the economy continues to need monetary support, bolstering expectations for prolonged stimulus measures. The S&P 500 rose 0.5% to 1,790.62 while the Dow Jones Industrial Average gained 0.4% to 15,876.22.
Weekly initial jobless claims fell by 2,000 to 339,000 in the week ended Nov. 9, the Labor Department reported Thursday, but still came in higher than the 330,000 expected by economists. Global markets were gaining ground while Treasury yields eased, driven by confidence of continued Fed support.
In ETF news, UBS Investment Bank has launched the ETRACS Monthly Pay 2x Leveraged Diversified High Income ETN (DVHL) on the NYSE. This should be exciting for those looking for income on a diversified asset pool, although some historical data will have to be established first before this newcomer can be considered as a valid alternative.
Let’s head over to our ETFs in the spotlight: