ETFs On The Cutline – Updated Through 09/22/2023

Ulli ETFs on the Cutline Contact

Do you want to know which ETFs are hot and which ones are not? Then you need my High-Volume ETF Cutline report. It tells you how close or far each of the 311 ETFs I follow is from its long-term trend line (39-week SMA). These are the ETFs that trade more than $5 million a day, so they are not some obscure funds that nobody cares about.

The report is split into two parts: The winners that are above their trend line (%M/A), and the losers that are below it. The yellow line is the line of shame that separates them. You can see how many ETFs are in each group and how they have changed since the last report (156 vs. 88 current).

Take a peek:

The HV ETF Master Cutline Report

If you are confused by some of the terms we use, don’t panic. I have a helpful Glossary of Terms for you.

If you want to learn more about the Cutline method and how it can make you rich (or at least less poor), read my original post here.

ETF Tracker Newsletter For September 22, 2023

Ulli ETF Tracker Contact

ETF Tracker StatSheet          

You can view the latest version here.

MARKETS HIT WALL OF WORRY, FED TALKS TOUGH, GOVERNMENT SHUTDOWN LOOMS

[Chart courtesy of MarketWatch.com]

  1. Moving the markets

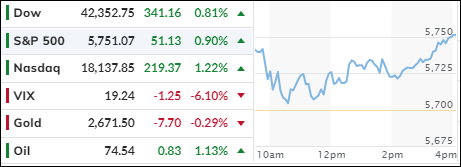
The markets tried to shake off their blues, but hit a wall of red. The indexes turned around and slid below unchanged lines. They couldn’t make a comeback and ended up with the fourth loss in a row.

This triggered our domestic “Sell” signal, as I warned you yesterday. You can find more details in section 3 below. The S&P 500 had a terrible week, losing about 3% and posting its worst performance since March. It was also the third week in the negative zone.

Even the most hated stocks couldn’t help the recovery. They suffered their second month of declines (and seventh week out of eight). This was the biggest weekly drop for the short basket since March.

Bond yields soared this week after the Fed hinted at one more rate hike for 2023. The 10-year Treasury yield jumped to 4.498%, the highest level since 2007. The 2-year rate reached 5.2%, the highest level since 2006.

Traders also worried about a possible government shutdown, which could hurt consumer confidence and slow down the economy. House Republicans decided to take a break on Thursday. Everyone knows that the government will shut down sooner or later, and the markets are just waiting for it to happen, and then guessing how long it will last.

Despite the Fed’s repeated messages that they want to keep rates “higher for longer” and that a ‘pause’ is not the start of a rate-cut cycle, the markets ignored them… until this week. As this chart from Google Trends shows, people are finally listening to the Fed.

ZeroHedge summed it up like this:

• *FED’S COLLINS: FURTHER FED HIKES ‘CERTAINLY NOT OFF THE TABLE’, EXPECT RATES MAY HAVE TO STAY HIGHER FOR LONGER

• *FED’s BOWMAN: MORE RATE HIKES LIKELY NEEDED TO GET INFLATION TO 2%, NEED TO REPEAT MONETARY POLICY ISN’T ON PRESET COURSE

• *FED’S DALY: I DON’T GET TO A POINT WHERE I’M READY TO DECLARE VICTORY, UNLIKELY INFLATION WILL REACH 2% GOAL IN 2024

So, no surprise that the market has changed its mind about the Fed’s rate path. The odds of a rate hike in 2023 are lower and the odds of a rate cut in 2024 are much lower.

The dollar had a strong week, rising for the eighth time in nine weeks. Crude oil had a lot of drama but ended flat. Gold was also unchanged.

Looking at the latest update comparing the AI Boom with Covid/Crypto bust, we can see that we are still on track.

Will history repeat itself?

Read More

Weekly StatSheet For The ETF Tracker Newsletter – Updated Through 09/21/2023

Ulli ETF StatSheet Contact

ETF Data updated through Thursday, September 21, 2023

How to use this StatSheet:

  1. Out of the 1,800+ ETFs out there, I only pick the ones that trade over $5 million per day (HV ETFs), so you don’t get stuck with a lemon that nobody wants to buy or sell.
  1. Trend Tracking Indexes (TTIs)

These are the main indicators that tell you when to buy or sell Domestic and International ETFs (section 1 and 2). They do that by comparing their position to their long-term M/A (Moving Average). If they cross above, and stay there, it’s a green light to buy. If they fall below, and keep going, it’s a red light to sell. And to make sure you don’t lose your shirt if things go south, I also use a 12% trailing stop loss on all positions in these categories.

  1. All other investment areas don’t have a TTI and should be traded based on the position of each ETF relative to its own trend line (%M/A). That’s why I call them “Selective Buy.” In other words, if an ETF goes above its own trend line, you can buy it. But don’t forget to use a trailing sell stop of 12%, or less if you’re feeling nervous.

If some of these words sound like Greek to you, please check out the Glossary of Terms and new subscriber information in section 9.

  1. DOMESTIC EQUITY ETFs: SELL— since 09/22/2023

Click on chart to enlarge

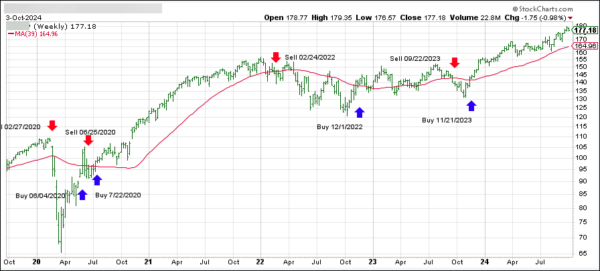
This is our main compass, the Domestic Trend Tracking Index (TTI-green line in the above chart). It has now broken below its long-term trend line (red) by -1.86% and has moved into “Sell” mode effectively tomorrow, unless the markets turn and surprise us with a solid rebound.

Read More

Stocks Slammed By Fed’s Hawkish Stance: Domestic “Sell” Signal Generated

Ulli Uncategorized Contact

[Chart courtesy of MarketWatch.com]

  1. Moving the markets

The market had a terrible day on Thursday. Stocks fell like rocks, as bond yields soared to levels not seen in years. The Fed is to blame, as it plans to keep raising interest rates and keep them high for a long time. The Fed thinks the economy is too hot and inflation is too high, so it wants to cool things down with higher rates. But the market thinks the Fed is making a mistake and risking a recession.

The Fed’s decision came after a report showed that the job market is still strong, with fewer people filing for unemployment benefits than expected. This means that more people have jobs and incomes, which is good for the economy. But it also means that the Fed has less reason to cut rates, which is bad for the market.

The Fed’s chair, Jerome Powell, tried to calm the market by saying that the economy could still land softly, without crashing hard. But he also said that this was not his main expectation. He sounded like he was not very confident about his own plan.

The market did not like what Powell said, or what he did not say. The market wanted him to say that he would cut rates soon, or at least stop raising them. But he did not say that. He said he would keep raising them and keep them high for longer.

The market reacted by selling stocks and buying bonds. This pushed up bond yields, which are the interest rates that bond investors get. Higher bond yields mean lower bond prices, and lower stock prices too. Higher bond yields also mean higher borrowing costs for businesses and consumers, which can hurt the economy.

The market was already worried about other things, like the housing market slowing down, the manufacturing sector shrinking, and the government shutting down. These things can also hurt the economy and make the market nervous.

The market was so nervous that it broke some important support levels, which are the prices that usually stop the market from falling further. When these levels are broken, the market can fall even more.

Equities fell so much that our Domestic Trend Index turned more negative and gave us a “Sell” signal for domestic equity funds. This means that we should sell these funds tomorrow unless the market bounces back strongly. See section 3 below for more details.

I am doing this to protect our portfolios from losing more value if the market keeps falling. I think it is better to be cautious than reckless in these uncertain times.

Stay tuned.

Read More

Fed Confuses Everyone: Markets Lose It

Ulli Market Commentary Contact

[Chart courtesy of MarketWatch.com]

  1. Moving the markets

The Fed meeting was the main event of the day, as everyone waited with bated breath to see what the central bank would do with interest rates. Would they hike, cut, or hold steady? Would they signal a dovish or hawkish stance? Would they make any jokes or puns to lighten the mood? Spoiler alert: they did none of the above.

Instead, the Fed delivered a mixed bag of messages that left the markets confused and disappointed. They kept rates unchanged, as expected, but hinted at one more hike before the year ends.

They also said they would start cutting rates next year, but not as much as they previously indicated. They raised their growth and inflation forecasts but lowered their unemployment projections. They said they would be careful and flexible, but also vigilant and proactive.

In other words, the Fed tried to have their cake and eat it too. But the markets were not amused. They wanted a clear and consistent direction from the Fed, not a wishy-washy and contradictory one. They wanted a Fed that was either done or ready to cut, not one that was still hiking while preparing to cut. They wanted a Fed that was either fighting inflation or supporting growth, not one that was doing both at the same time.

So, what did the markets do? They threw a tantrum. The major indexes plunged into the close, with the S&P barely clinging to its 4,400 level. Bond yields spiked, with the 2-year hitting a new high since 2006. The most shorted stocks tanked, as investors lost their appetite for risk. The dollar went on a roller coaster ride, which reversed gold’s early gains.

The only winners of the day were the oil prices, which eased slightly after reaching $92 on Tuesday. But that was hardly a consolation prize for the markets, which feared that higher energy prices would fuel inflation and slow down the economy.

The bottom line is that uncertainty reigned today, as the Fed failed to deliver a clear and coherent message to the markets.

The question now is: Will the Fed change its tune in the next meeting, or will it continue to confuse and disappoint?

Read More

Stocks Tumble, Fed Mumbles, Oil Rumbles, And Bonds Crumble

Ulli Market Commentary Contact

[Chart courtesy of MarketWatch.com]

  1. Moving the markets

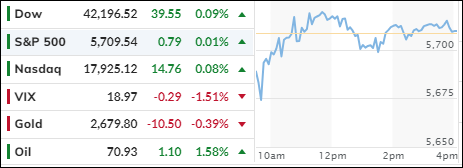
The markets had a bad hair day on Tuesday as they waited for the Federal Reserve to wake up and make a move. After plunging in the middle of the day, the major indexes clawed their way back up but still ended in the red.

The central bank’s two-day meeting started on Tuesday, but nobody expected any surprises. The Fed was likely to keep rates unchanged on Wednesday, with traders betting 99% that the bank would hit the snooze button. Traders were also skeptical that the Fed would hike rates in November, giving it only a 29% chance.

The Fed was also supposed to give some economic forecasts on Wednesday, but investors were more interested in what the bank would say about inflation and interest rates.

Would the Fed admit that prices were rising faster than expected? Would the Fed hint at when it would start tapering its bond-buying program? Would the Fed crack a joke to lighten the mood?

Analysts believed that the Fed was trying to land the economy softly, like a feather on a pillow. Consumer spending was strong in the summer, but economists predicted that it would slow down as people ran out of stimulus money. Plus, many young Americans had to start paying back their student loans, which meant less money for avocado toast and Netflix.

Oil prices soared on Tuesday, with Brent crossing the $95 mark. The surge in prices helped energy stocks within the S&P 500 reduce their losses in the index. Oil was having a blast, unlike bonds, which were having a blast from the past. Bond yields jumped to 16-year highs, which made their prices drop to their lowest level since October 2007.

The markets realized that the Fed was not kidding when it said it would keep rates higher for longer. Next year’s rate hike expectations skyrocketed, which made bond investors cry.

As a result, regional banks kept sinking, as they struggled to make money from lending. The dollar was also confused, as it moved up and down without direction. Gold tried to rally but gave up and closed flat. Oil prices had a wild ride, as they spiked and then dropped, with WTI finding support at $90.

The gap between bonds and the S&P 500 was obvious and raised a question: “Which way will the alligator jaw snap shut?” Will bonds catch up with stocks or will stocks fall and catch up with bonds?

Or will they both get eaten by the alligator?

Read More