Back In Black Tuesday

Ulli Market Commentary Contact

Tue pic

[Chart courtesy of MarketWatch.com]

1. Moving the Markets

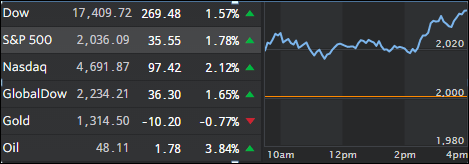
Markets on Tuesday flashed their first signs of stabilization as the Dow shot up more than 200 points following a sullied performance last week after the U.K. exit. I am sure equity indexes were oversold during the past couple of days, but it remains to be seen whether this is just hopeful bargain hunting combined with quarter-end window dressing or the resumption of the previous bull market. Global economic weakness and over-indebtedness are still lurking in the background and could put an end to this apparent volume-less dead cat bounce in a hurry.

Stocks that moved higher today include digital marketing company ReachLocal (RLOC) on its merger with Gannett (GCI), Cigna (CI) and SolarCity (SCTY) as Elon Musk’s solar systems maker formed a special committee to evaluate Tesla’s (TSLA) takeover bid. The panel’s creation is seeking to avoid any potential conflicts of interest between the two companies.

In pharma news, we heard today that U.S. pharmaceutical giant Pfizer (PFE) plans to invest roughly $350 million to develop a biotechnology center in China, which could increase the company’s footprint in the world’s second-largest pharmaceutical market. The new facility, which will be their first in China, will be built in Hangzhou and will provide both biologic treatments (medications made in microorganisms, plants or animal cells) for patients in China and worldwide.

Read More

Brexit Hits Home—Trend Tracking Indexes Drop Into Bear Market Territory

Ulli Market Commentary Contact

Mon pic

[Chart courtesy of MarketWatch.com]

1. Moving the Markets

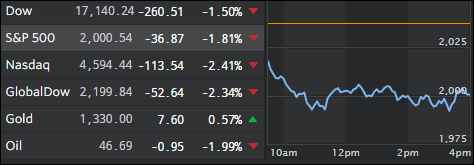
Following the Brexit vote late last week, markets did not boomerang back into positive territory today as some had hoped. In fact, all 3 major indexes here in the U.S. dropped at least 1.5%. What I can tell from today’s trading session, is that the path forward for stocks will continue to be rocky for some time while the political uncertainty in the U.K. and E.U. drags on.

Things looked pretty dicey this morning when the S&P 500 not only knifed through its widely followed 200-day moving average but also broke below its psychologically important 2,000 milestone marker, which it managed to recover by a small margin as we rebounded into the close. Before things got worse and to reduce exposure, I took the opportunity to sell some of our equity ETF positions. We’re still holding on to consumer staples, utilities and gold miners.

The Brexit largely affected bank stocks today, with shares of Barclays (BCS) closing down nearly 21% at $7.03, which marked a second consecutive trading day of double-digit losses for the stock. Britain’s exit also hit Royal Bank of Scotland (RBS), sending the bank’s shares down 13.6% to $4.69 close. The new drop followed a 27.5% plummet in the stock on Friday. Even U.S. bank stocks were not immune and got clobbered.

Our Trend Tracking Indexes (TTIs) have now slipped below their respective long term trend lines. For more details, please see section 3 below.

Read More

One Man’s Opinion: Lather. Rinse. Repeat.

Ulli Market Review Contact

ManSubmitted by Peter Schiff via Euro Pacific Capital,

Stop me if you’ve heard this one before: A Fed official walks into a bar and says the economy is improving and rate hikes are appropriate. The patrons order another round to celebrate. Then disappointing data comes out, the high fives stop, and the Fed official ducks out the back…only to come back the next day saying the same thing. Anyone who pays even the smallest attention to the financial media has experienced versions of this joke dozens of times. Yet every time the gag gets underway, we raise our glasses and expect the punch line to be different. But it never is. Last week was just the latest re-telling.

For nearly a month the Fed’s bullish statements stoked optimism on the economy and raised expectations, based particularly on the most recent FOMC minutes, for a summer rate hike. But these hopes were dashed by the May non-farm payroll report, which reported the creation of only 38,000 jobs in May, the worst monthly performance in six years, based on data from the Bureau of Labor Statistics (BLS). The number missed Wall Street’s estimate by a staggering 120,000 jobs. If not for the 37,000 downward revision reported for April (160,000 jobs down to 123,000), May could have shown a contraction. This would have constituted a major black eye to the Obama Administration’s favorite talking point that its policies have led to 75 months of continuous job gains. (6/3/16, Democratic Policy & Communications Center).

Read More

ETFs/Mutual Funds On The Cutline – Updated Through 06/24/2016

Ulli ETFs on the Cutline Contact

Below are the latest ETF Cutline reports, which show how far above or below their respective long-term trend lines (39 week SMA) my currently tracked ETFs/MFs are positioned.

The first report covers the ETF Master List from Thursday’s StatSheet and includes 381 ETFs, of which currently 234 (last week 284) are hovering in bullish territory.

The second report includes only High Volume ETFs. To clarify, High Volume (HV) ETFs are defined as those with an average daily volume of $10 million or higher. Volume figures can change in a hurry, so be sure to check first before investing.

These ETFs are generated from my selected list of 98 that I use in my advisor practice. It cuts out the “noise,” which simply means it eliminates those ETFs that I would never buy because of their volume limitations. 58 ETFs (last week 67) have managed to remain in bullish territory after the recent market volatility.

The third report covers Mutual Funds on the Cutline. There are currently 259 (last week 417) above the line and 521 below it out of the 780 that I follow.

Take a look:

  1. ETF Master Cutline Report
  2. ETF High Volume Cutline Report
  3. MF Cutline Report

In case you are not familiar with some of the terminology used in the reports, please read the Glossary of Terms.

If you missed the original post about the Cutline approach, you can read it here.

ETF/No Load Fund Tracker Newsletter For June 24, 2016

Ulli ETF Tracker Contact

ETF/No Load Fund Tracker StatSheet

————————————————————-

https://theetfbully.com/2016/06/weekly-statsheet-for-the-etfno-load-fund-tracker-newsletter-updated-through-06232016/

————————————————————

Market Commentary

BREXIT SHATTERS COMPLACENCY—THE MORNING AFTER

Fri pic

[Chart courtesy of MarketWatch.com]

1. Moving the Markets

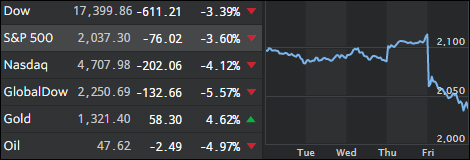
What a difference a day makes. There we were closing in on all-time new highs on the S&P 500 on Thursday and just one day later, we’re heading the other direction in a big way with the U.S. stock market suffering its worst drop in 10 months. The British decided via their referendum to leave the European Union, which was won 52% to 48% in favor of the “Leave” folks. Good for them as they now will be able again to make independent decisions about their country without the mandatory input of their EU overlords.

Worldwide, equities got spanked with the most damage being done to the Nikkei and the various European indexes. Domestically, the major indexes went south as well, but to a lesser degree as the table above shows. King of the hill was gold and gold miners, which rallied +4.62% and +5.91% respectively.

Sure, it looks like the Fed’s plan of raising interest rates this year has gone out the window and not just because of the Brexit result but also due to ever sliding economic data points, which makes an eventual rate cut far more likely than a hike.

The big question is: Will there be more selling ahead? It’s certainly a possibility as some big investors using leverage are bound to get some margin calls, which may push markets lower along with continued fears of more fallout from the EU as other counties appear to be waiting on deck ready for their own version of Brexit.

Of course, there are always dip buyers out there looking to catch the falling knife hoping for a rebound. However, as trend followers, we don’t concern ourselves with these issues but are watching the major trends as identified by our Trend Tracking Indexes (TTIs). Both have been affected, and you can read the details in section 3 below.

Read More

Weekly StatSheet For The ETF/No Load Fund Tracker Newsletter – Updated Through 06/23/2016

Ulli ETF StatSheet Contact

ETF/Mutual Fund Data updated through Thursday, June 23, 2016

TOC060916

If you are not familiar with some of the terminology used, please see the Glossary of Terms.


1. DOMESTIC EQUITY MUTUAL FUNDS/ETFs: BUY — since 4/4/2016

TTI

Our main directional indicator, the Domestic Trend Tracking Index (TTI-green line in above chart) remains above its long term trend line (red) by +2.03% after having generated a new Domestic Buy signal effective 4/4/2016 as posted.

Read More