ETF Tracker StatSheet
https://theetfbully.com/2017/07/weekly-statsheet-etf-tracker-newsletter-updated-07272017/
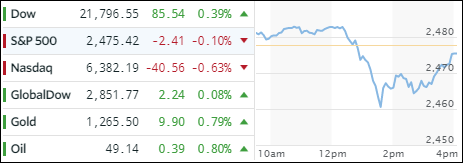
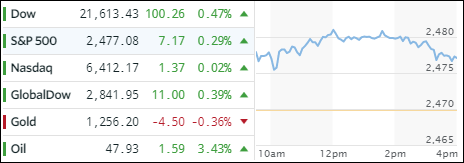
DOW CLOSES AT RECORD; TECH IS WEIGHING ON S&P AND NASDAQ
[Chart courtesy of MarketWatch.com]
- Moving the Markets
Much of the retail store apocalypse has been blamed on online sales, despite the fact that they only account for about 8% of total retail sales. Amazon was one of the alleged guilty parties contributing to the consumer discretionary skid. Well, this morning Amazon stock took a -3.5% dive confirming in a way that lack of consumer spending, due to worsening economic conditions, may very well be at the core of the issue in addition to Amazon’s 77% plunge in second quarter earnings, a result of jumping operating expenses across the board.
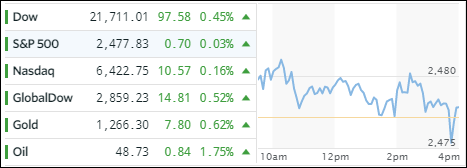
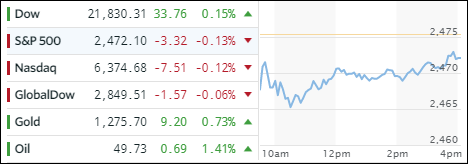
The early morning sell-off proved to be a tough one to reverse and, despite the VIX being crushed again (but it had its biggest weekly gain in 2 months), only the Dow managed to crawl above the unchanged line to set a new record close. The other two major indexes ended up slightly in the red with the S&P 500, to much shock and horror, actually losing 1 point for the week, after having chalked up 3 weekly gains in a row.
The FANG stocks had their first down week in the last 4; interest rates dropped today and also ended lower for the week. Not only did 2nd Qtr GDP miss at 2.6% vs. an expected 2.7%, but 1st Qtr GDP was revised down from 1.4% to 1.2%, which makes me curious as to what next month’s revision will bring.
The dollar index continued its dive losing another -0.62% for the day allowing gold to rally for the 3rd straight week and conquering its 50-, 100- and 200-day M/As to close at $1,275, its highest level since the beginning of June.
Read More