
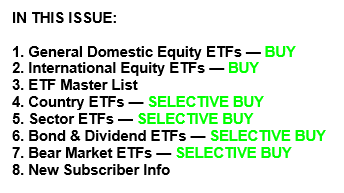
1. Moving the markets
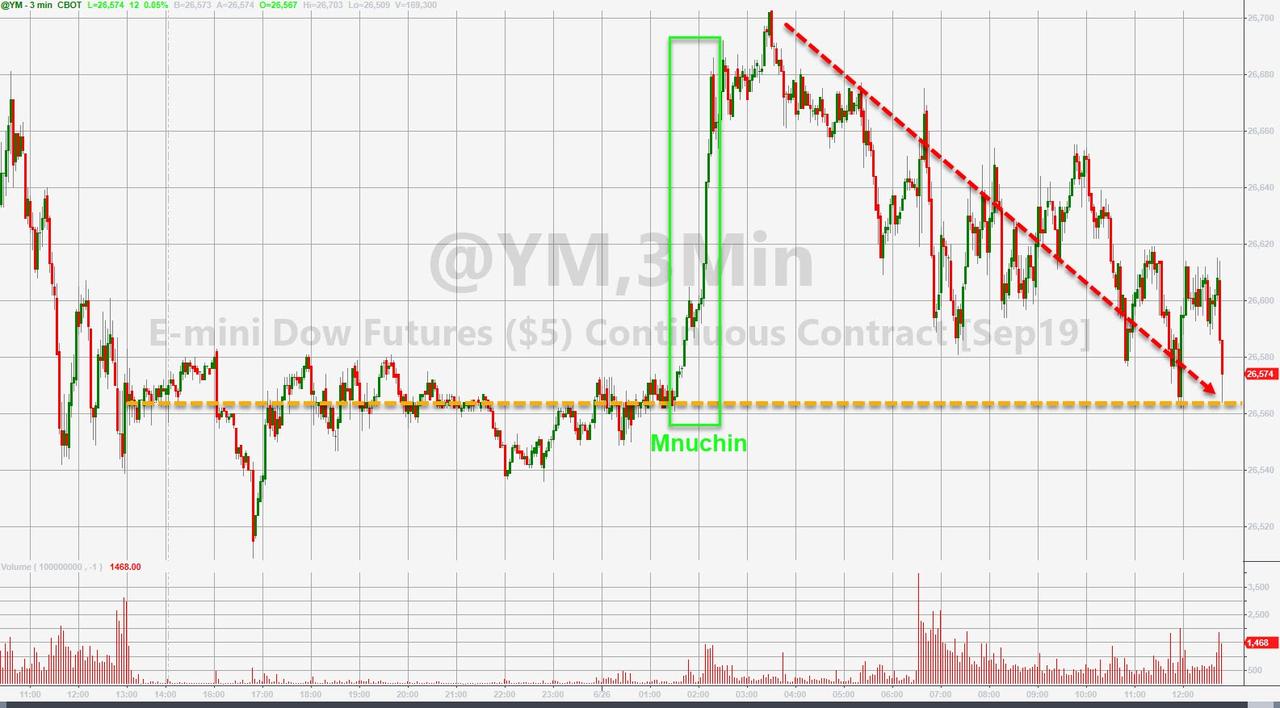
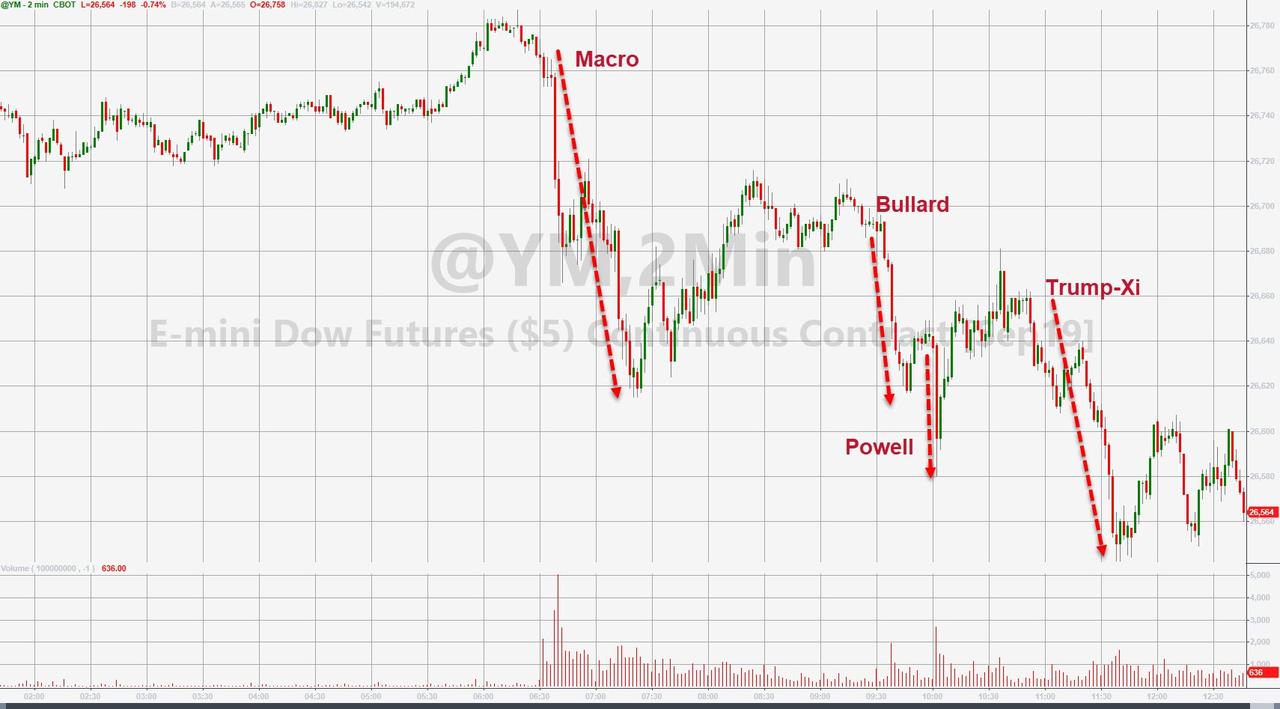
I had to laugh this morning, when I saw the early market spike explained as having been a grammatical error. According to an early CNBC headline saying that Treasury Secretary Mnuchin said a trade deal “IS” 90% complete, and repeated by Bloomberg, pushed the computer algos into buying mode.
As it turned out, CNBC made an error, because instead of saying “is,” Mnuchin was actually using the past tense and said that we “were” about 90% on the way to a China trade deal. Ouch! Therefore, the early buying spree turned into a false alarm with the algos back peddling and the market slipping and sliding into the close.
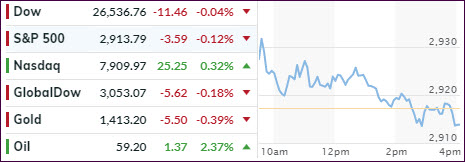
In the end, not much was gained, expect the Nasdaq closed in the green, thanks to a 14% pop in Micron stock.
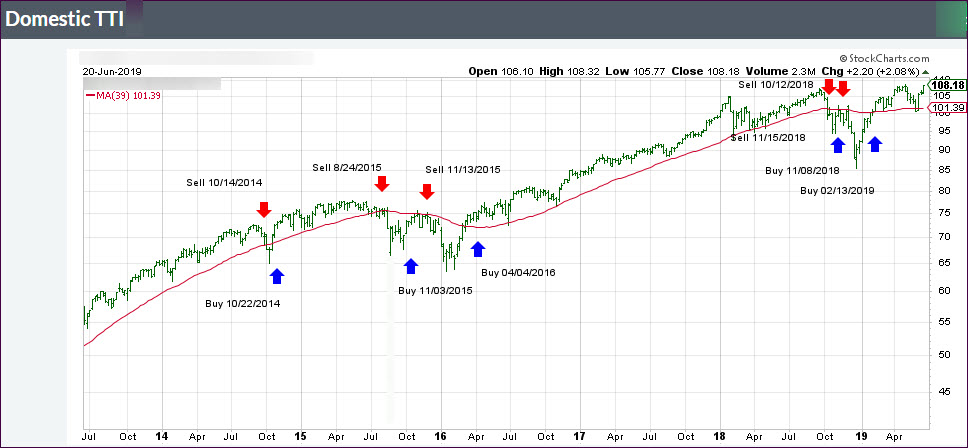
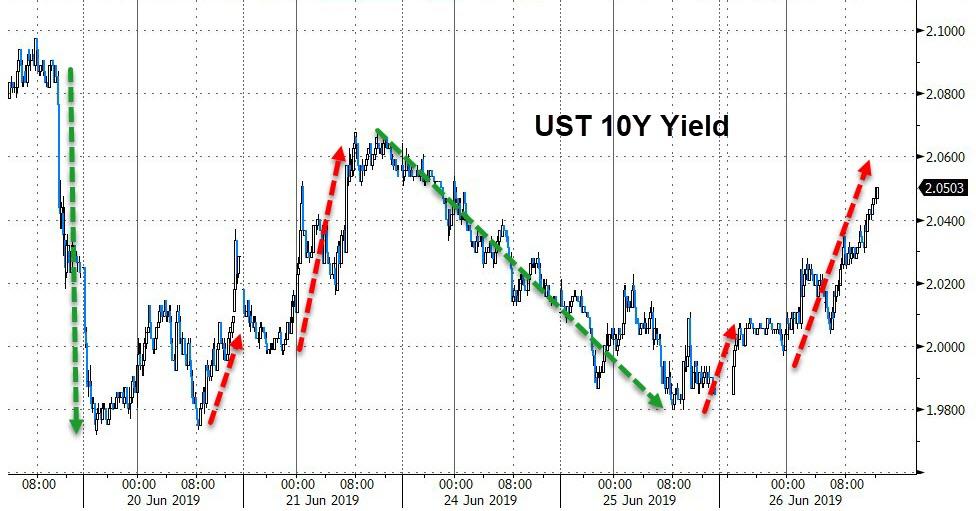
Not helping matters was a sudden jump in bond yields with the 10-year gaining 6 basis points to close back above the 2% level. As a result, the low volatility ETF SPLV, which we own, had a down day, but it remains ahead of SPY for this domestic ‘Buy’ cycle.
With the widely anticipated G-20 meeting on deck for this weekend, I expect market direction to be predominantly sideways for the next couple of days. For sure, we’re bound to see more clarity this coming Monday.
Read More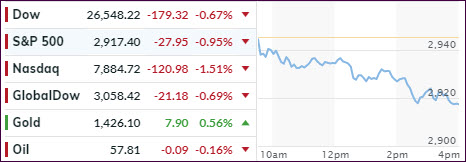