Wall Street Rises On Rate Cut Hopes; Buffet’s Caution Raises Eyebrows

Ulli Market Commentary Contact

[Chart courtesy of MarketWatch.com]

  1. Moving the markets

Today’s financial markets saw a continuation of growth, with major indexes like the S&P 500, and Nasdaq each climbing over 1% in value. This surge was fueled by the latest jobs report, which indicated slower-than-anticipated job growth in April and a slight uptick in unemployment rates. These figures have quelled concerns about an overheated economy and have sparked optimism among traders who now anticipate the Federal Reserve might lower interest rates sooner than expected.

Despite the prevailing narrative of “stagflation” market participants are adjusting their expectations, factoring in two potential rate cuts in 2024 and an additional three in 2025. As the first-quarter earnings season winds down, attention shifts to the forthcoming financial disclosures from prominent companies such as Disney and Uber, scheduled for this week.

During this, the market dynamics have been diverse: Small Caps have outshined, continuing their robust performance, while the MAG7 stocks have also seen an upward trajectory. However, the Dow experienced a slight lag in comparison.

The bond market showed mixed results, the dollar remained relatively stable, and Bitcoin experienced a rally before encountering a setback due to regulatory actions involving Robinhood. Meanwhile, oil prices fluctuated significantly, and gold prices built upon the previous week’s gains.

Amidst the market’s positive outlook, a note of caution arises from Warren Buffet’s recent actions. Known for his astute market insights, Buffet has amassed a record-breaking cash reserve of approximately $180 billion, signaling a potential warning to investors.

This raises the question: Is Warren Buffet anticipating a scenario that others on Wall Street are overlooking?

Read More

ETFs On The Cutline – Updated Through 05/03/2024

Ulli ETFs on the Cutline Contact

Do you want to know which ETFs are hot and which ones are not? Then you need my High-Volume ETF Cutline report. It tells you how close or far each of the 311 ETFs I follow is from its long-term trend line (39-week SMA). These are the ETFs that trade more than $5 million a day, so they are not some obscure funds that nobody cares about.

The report is split into two parts: The winners that are above their trend line (%M/A), and the losers that are below it. The yellow line is the line of shame that separates them. You can see how many ETFs are in each group and how they have changed since the last report (242 vs. 259 current).

Take a peek:

The HV ETF Master Cutline Report

If you are confused by some of the terms we use, don’t panic. I have a helpful Glossary of Terms for you.

If you want to learn more about the Cutline method and how it can make you rich (or at least less poor), read my original post here.

ETF Tracker Newsletter For May 3, 2024

Ulli ETF Tracker Contact

ETF Tracker StatSheet          

You can view the latest version here.

ECONOMIC DATA DISAPPOINTS, BUT MARKETS CLING TO RATE CUT DREAMS

[Chart courtesy of MarketWatch.com]

  1. Moving the markets

Today’s stock market witnessed a significant surge, buoyed by the April jobs report which fell short of expectations, sparking speculation that the Federal Reserve might consider reducing interest rates soon.

The report indicated an addition of 175,000 jobs in April, a figure notably lower than the 240,000 forecasted by economists. This was accompanied by a slight uptick in the unemployment rate to 3.9% from the previous month’s 3.8%, and subdued wage growth — factors that allegedly suggest a tempering of inflationary pressures.

The market’s reaction was swift, as these figures alleviated concerns over an overheating economy, thereby renewing optimism for potential rate cuts. This sentiment was reflected in the falling interest rates, a rally in bond markets, and a general uplift in equity markets.

The prevailing view is that the Federal Reserve might initiate interest rate cuts later this year, prompted by a single set of data points that are subject to future revisions. Hmm…

Following the labor report, the yield on the 10-year Treasury note dipped below 4.5%. Federal Reserve Chair Jerome Powell, in the recent Fed meeting, indicated the central bank’s readiness to respond should the unemployment rate rise.

Contributing to the market’s positive performance were robust quarterly reports from key Dow components. Apple’s shares climbed 6% after the tech giant announced a substantial share buyback program and exceeded earnings expectations. Similarly, biotech firm Amgen’s shares soared by 12% on the back of strong earnings results.

Despite the upbeat market, the Macro Surprise index plummeted to its lowest level since February 2023, signaling a disconnect between economic data and market performance. The economy is grappling with stagnating growth and rising inflation — a scenario reminiscent of stagflation, which the Federal Reserve has yet to acknowledge officially.

The Nasdaq stood out, with the MAG7 stocks experiencing volatility yet trending towards record highs. Meanwhile, the most heavily shorted stocks underwent their most significant squeeze in two months, and the utility sector emerged as this week’s standout performer.

In the bond market, yields fell sharply, with the 2-year yield notably retreating from its 5% mark. The U.S. dollar weakened, gold prices declined for a second consecutive week, and Bitcoin rebounded to surpass the $62,000 threshold. Conversely, crude oil prices experienced a downturn throughout the week, approaching their lowest in nearly two months.

The anticipation of a weaker economic outlook has led traders to entertain the possibility of two rate cuts in 2024, followed by three additional cuts in 2025. This raises the question:

Will the market’s hopeful anticipation of a dovish turn in monetary policy be met, or will it face another round of disappointment?

Read More

Weekly StatSheet For The ETF Tracker Newsletter – Updated Through 05/02/2024

Ulli ETF StatSheet Contact

ETF Data updated through Thursday, May 2, 2024

How to use this StatSheet:

  1. Out of the 1,800+ ETFs out there, I only pick the ones that trade over $5 million per day (HV ETFs), so you don’t get stuck with a lemon that nobody wants to buy or sell.
  1. Trend Tracking Indexes (TTIs)

These are the main indicators that tell you when to buy or sell Domestic and International ETFs (section 1 and 2). They do that by comparing their position to their long-term M/A (Moving Average). If they cross above, and stay there, it’s a green light to buy. If they fall below, and keep going, it’s a red light to sell. And to make sure you don’t lose your shirt if things go south, I also use a 12% trailing stop loss on all positions in these categories.

  1. All other investment areas don’t have a TTI and should be traded based on the position of each ETF relative to its own trend line (%M/A). That’s why I call them “Selective Buy.” In other words, if an ETF goes above its own trend line, you can buy it. But don’t forget to use a trailing sell stop of 12%, or less if you’re feeling nervous.

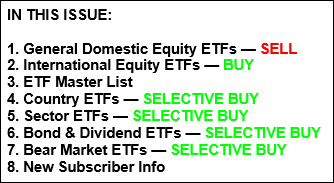
If some of these words sound like Greek to you, please check out the Glossary of Terms and new subscriber information in section 9.

  1. DOMESTIC EQUITY ETFs: BUY— since 11/21/2023

Click on chart to enlarge

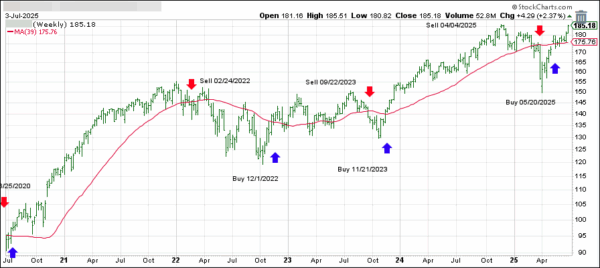
This is our main compass, the Domestic Trend Tracking Index (TTI-green line in the above chart). It has broken above its long-term trend line (red) by +6.24% and is in “Buy” mode as posted.

Read More

The Balancing Act: Market Reacts To Fed’s Stance And Mixed Corporate Results

Ulli Market Commentary Contact

[Chart courtesy of MarketWatch.com]

  1. Moving the markets

Today’s stock market presented a dynamic landscape, with investors casting their gaze forward to upcoming corporate earnings and a pivotal labor report due later in the week.

Amidst this anticipation, the market witnessed a diverse range of earnings outcomes. Qualcomm, the semiconductor giant, saw its shares climb by 9% following the announcement of earnings that surpassed expectations, coupled with a robust revenue forecast. Conversely, DoorDash experienced a 13% decline in its share price after its loss per share exceeded the projections set by analysts. In a remarkable turn of events, Carvana’s shares skyrocketed by 34%, buoyed by the company’s announcement of record-breaking earnings after Wednesday’s closing bell.

These fluctuations came on the heels of a tumultuous day on Wall Street, where investor sentiment was influenced by the Federal Reserve’s decision to maintain the status quo on interest rates.

Jerome Powell, the Fed Chair, in his press briefing, virtually eliminated the possibility of an interest rate hike as the Fed’s forthcoming action. This stance appeared to provide temporary relief to the markets. However, with persistent inflation showing no signs of abatement, Powell’s cautious remarks can be likened to a balancing act on a precarious tightrope.

In the realm of technology, U.S. equities halted their two-day downturn as tech stocks experienced a surge in the latter part of the trading session. The focus of Wall Street has now shifted to Apple’s post-market earnings announcement.

There is a buzz among some analysts who predict that Apple may unveil a significant stock repurchase scheme to counterbalance what could be an underwhelming earnings report. This speculation arises amidst a backdrop of numerous research reports over recent months that suggest a decline in iPhone sales internationally.

In the broader financial landscape, bond yields continued their descent for a second consecutive day. Gold prices remained relatively stable, while Bitcoin ETFs enjoyed a notable increase of nearly 4.5%. The S&P 500 index made headway but found itself wedged between its 50-day and 100-day moving averages.

As we stand at this crossroads, one can’t help but ponder: With such a confluence of factors at play, which direction will the S&P 500 take from here?

Read More

Market Turbulence: From Optimism To Disappointment

Ulli Market Commentary Contact

[Chart courtesy of MarketWatch.com]

  1. Moving the markets

Today, Wall Street witnessed a rollercoaster ride as the major indexes initially surged in response to the Federal Reserve’s decision to keep interest rates unchanged. However, this early enthusiasm gave way to disappointment as the S&P 500 and Nasdaq reversed course and ended the day in negative territory.

Fed Chair Jerome Powell cited a “lack of further progress” in taming inflation as the reason for maintaining rates. Inflation remains stubbornly high, and the path ahead is uncertain. But the Fed did signal a gradual approach to tightening financial conditions by slowing the pace of quantitative tightening—allowing maturing bonds to roll off the balance sheet without reinvesting them.

Traders welcomed this measured approach, but elsewhere, stocks tied to artificial intelligence faced headwinds. Advanced Micro Devices, Super Micro Computer, and Nvidia all grappled with disappointing reports.

Shorted stocks experienced a massive squeeze, while bond yields dropped, the dollar fluctuated but gold surged back above its $2,300 level. Bitcoin got dragged down with stocks, and crude oil followed the same theme.

Fed head Powell elaborated on not seeing stagflation, but maybe he missed this chart from Bloomberg, which makes the current condition abundantly clear.

Read More