
- Moving the market
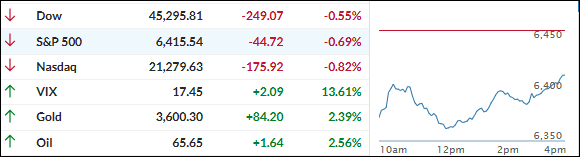
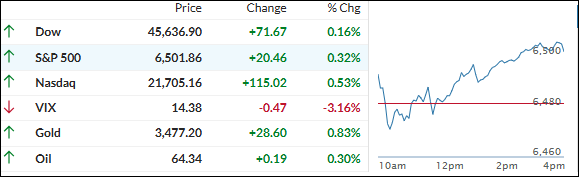
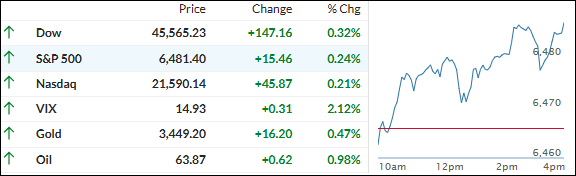
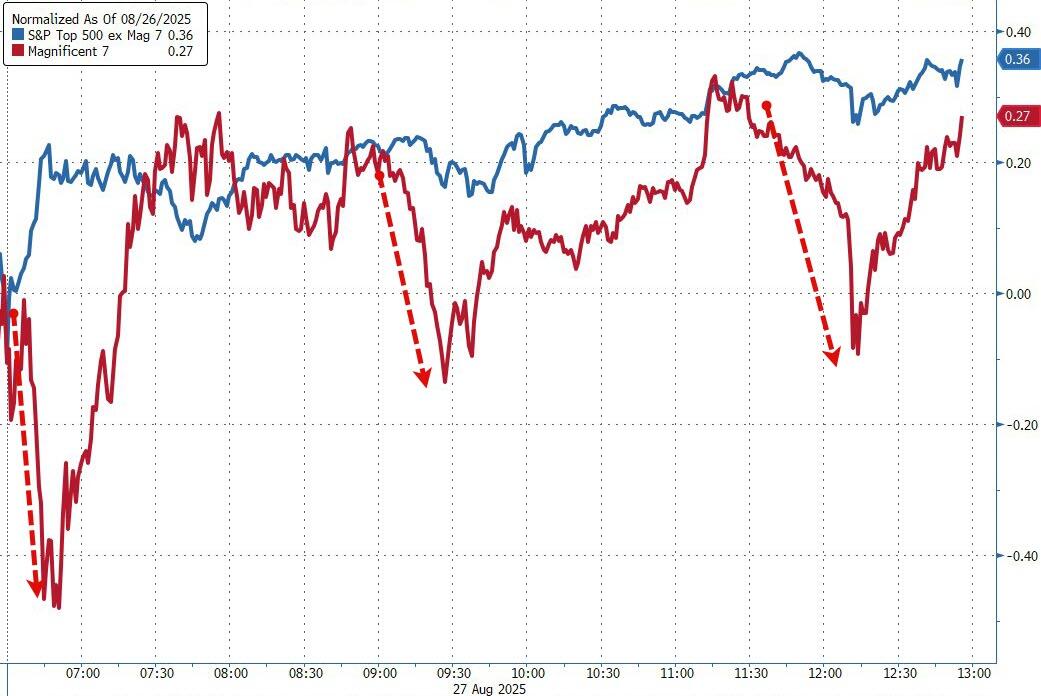
Stocks got off to a rough start this morning and just never caught a break, kicking off what’s usually a tricky month for the market.
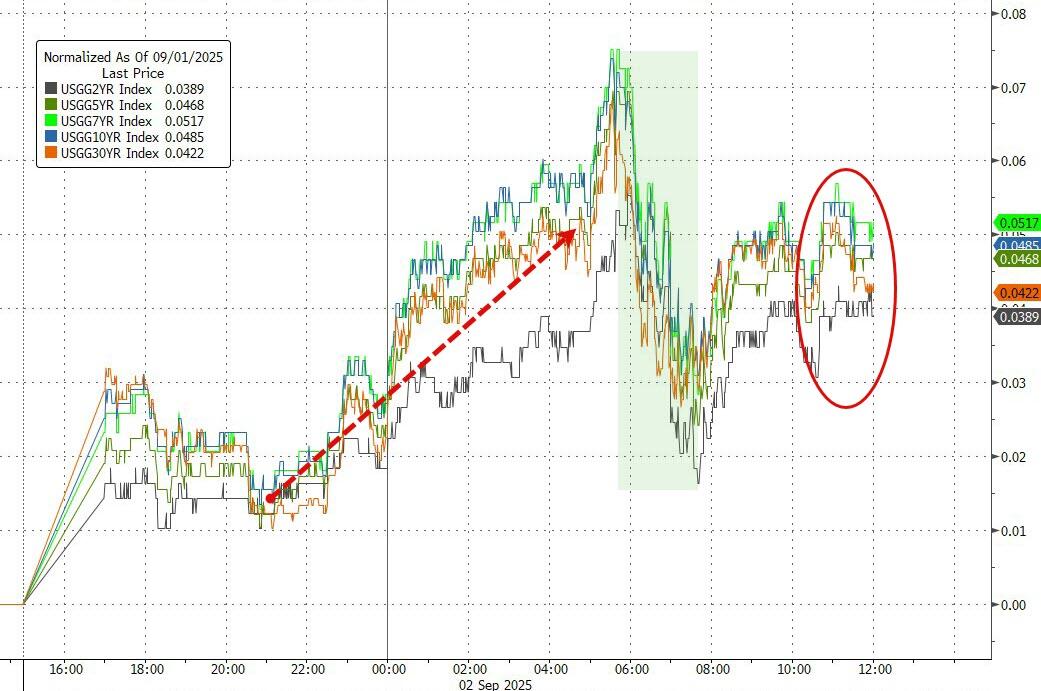
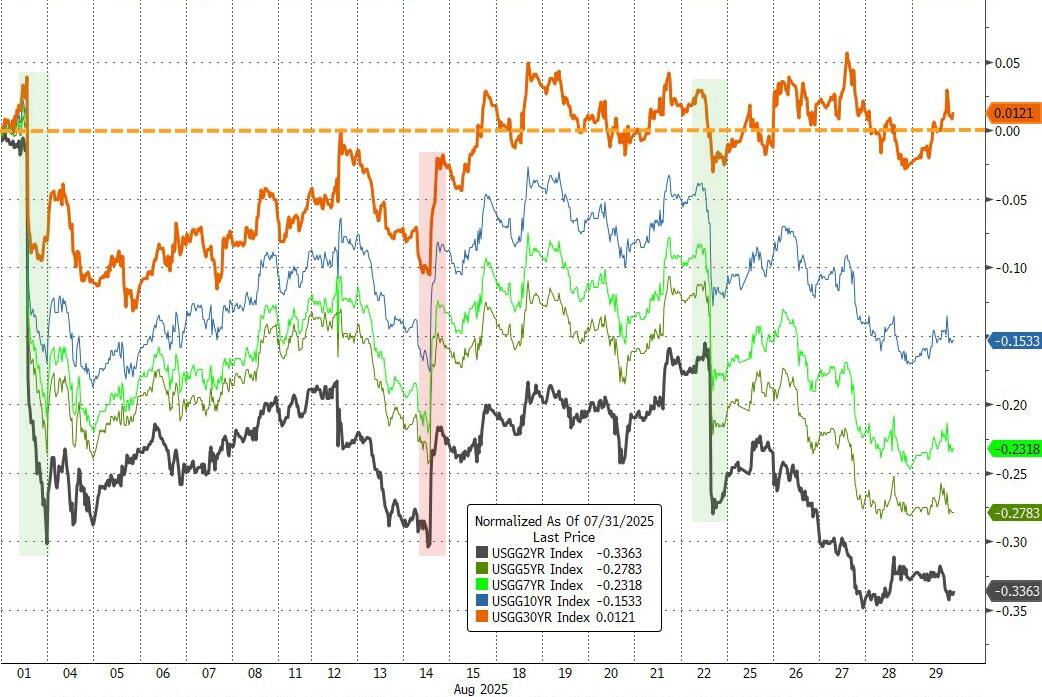
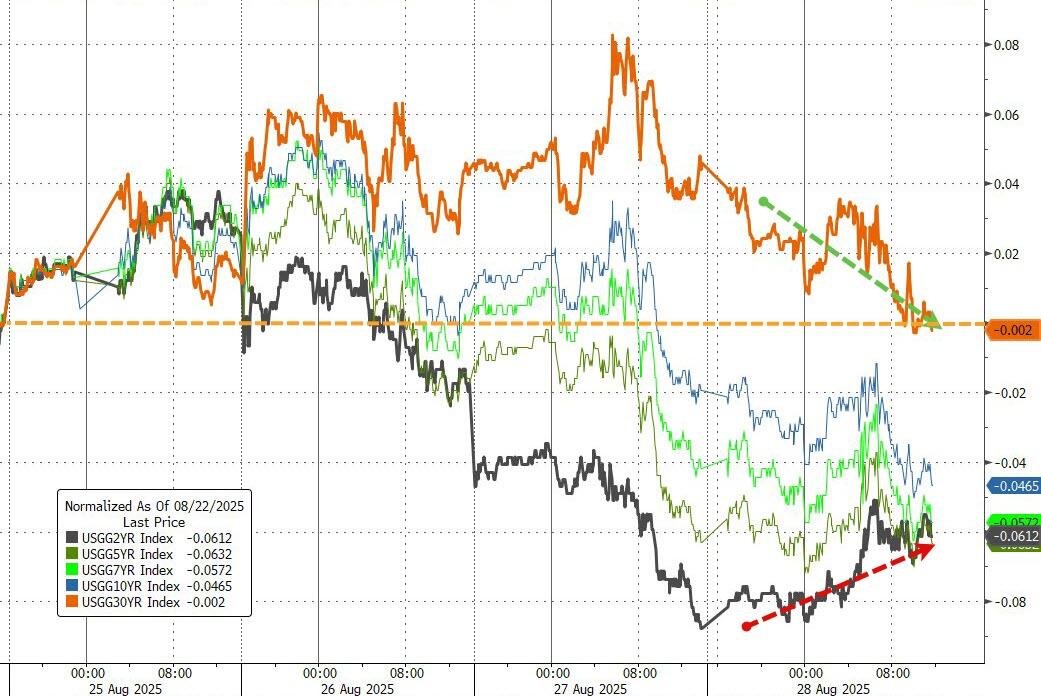
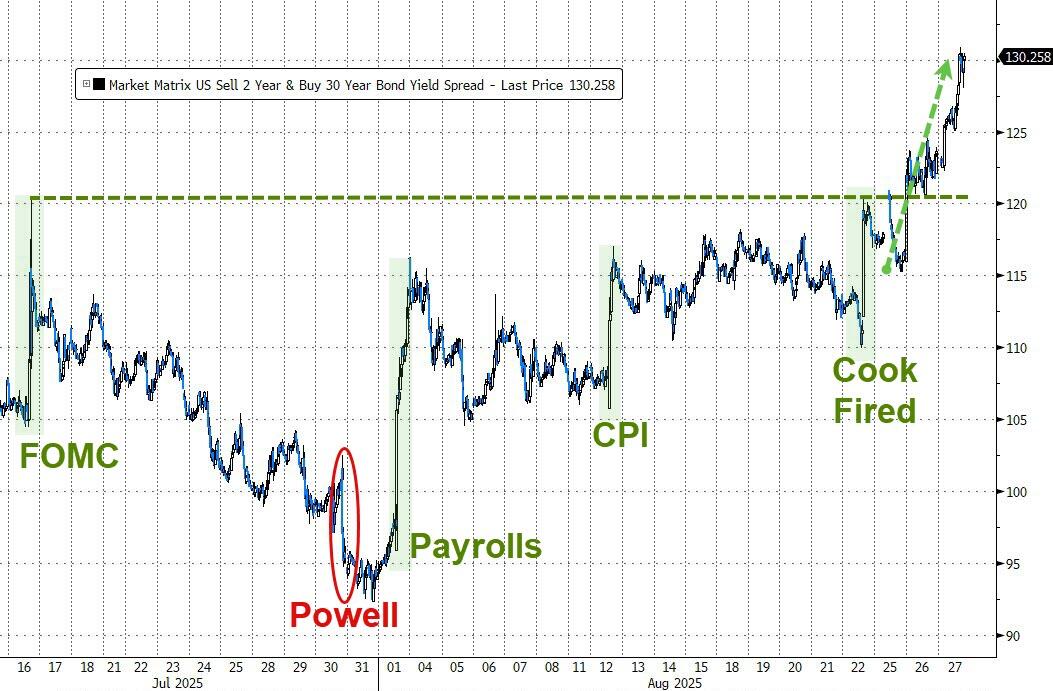
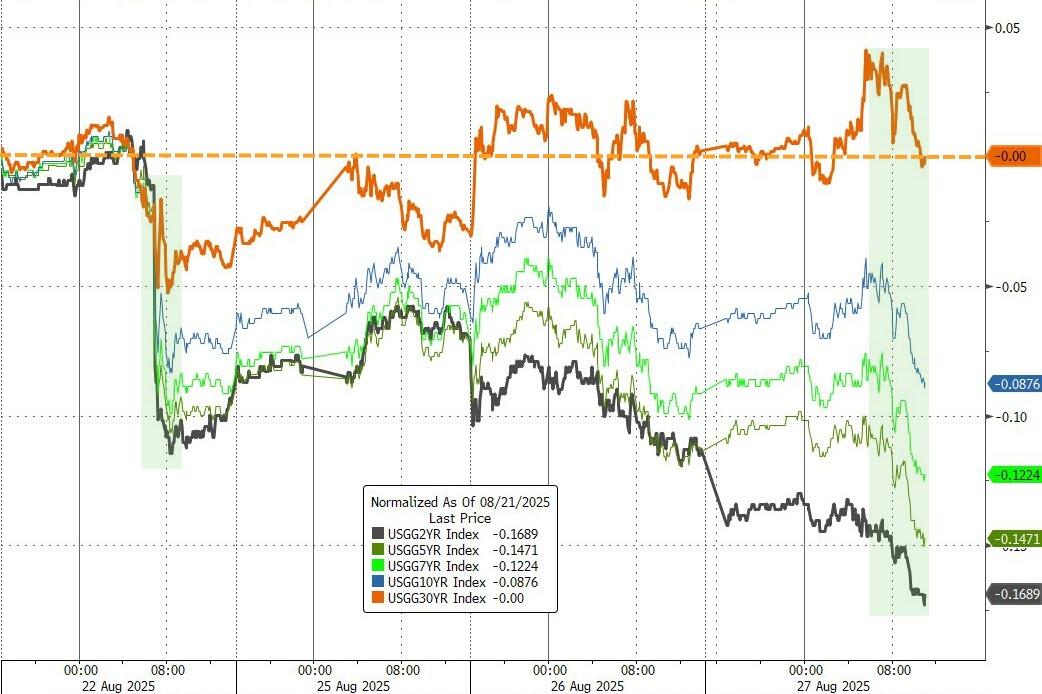
The major indexes finished solidly in the red, as traders grappled with fresh tariff drama and rising bond yields that sent Wall Street on edge—the 10-year pushed up to 4.27%, making everyone a bit jumpy.
Pressure ramped up after a federal appeals court ruled most of Trump’s global tariffs illegal, shifting focus to Congress—and prompting talk that the US might have to refund a big chunk of tariff revenue, which isn’t great news for government finances or market sentiment.
Trump wasn’t happy, calling the decision “Highly Partisan,” and said he’ll take it up with the Supreme Court. The combo of legal uncertainty and fiscal worries made it even tougher for stocks to gain traction today.
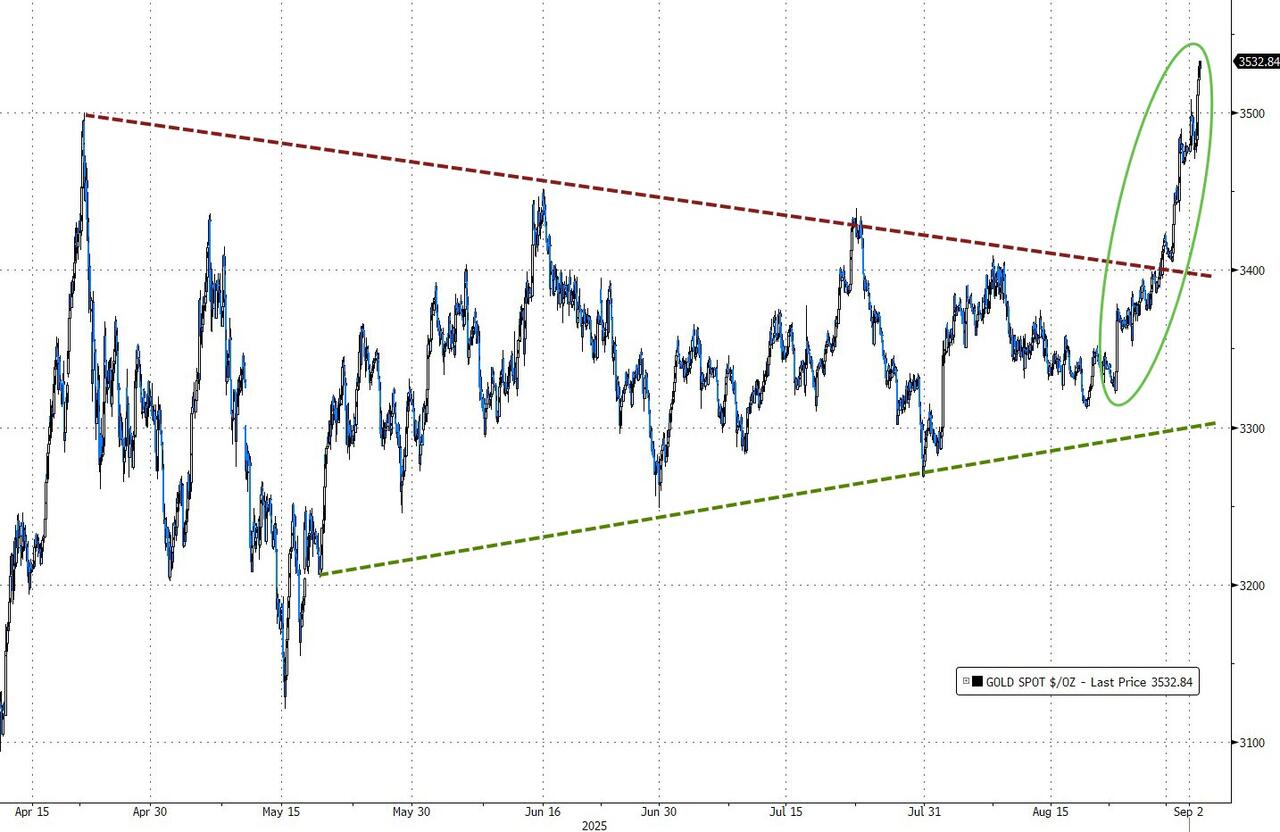
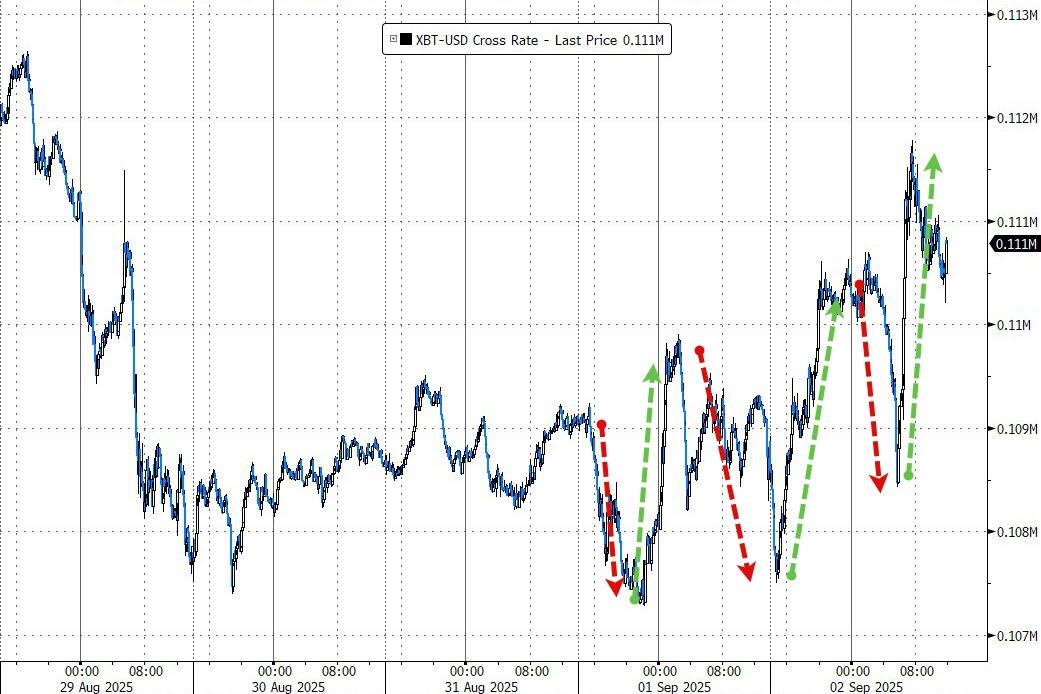
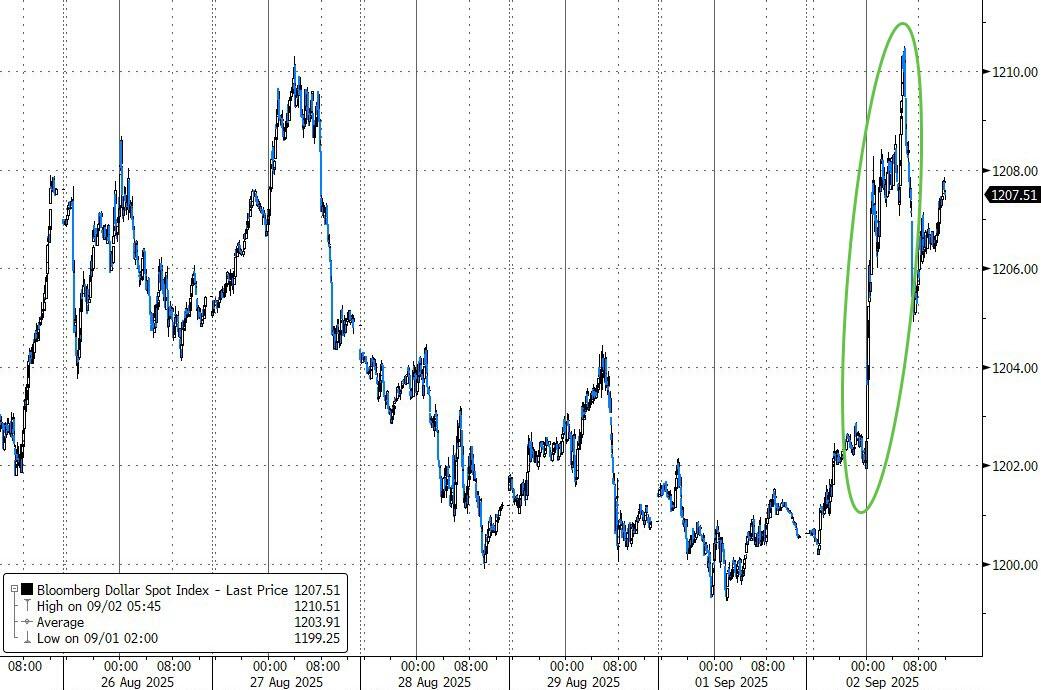
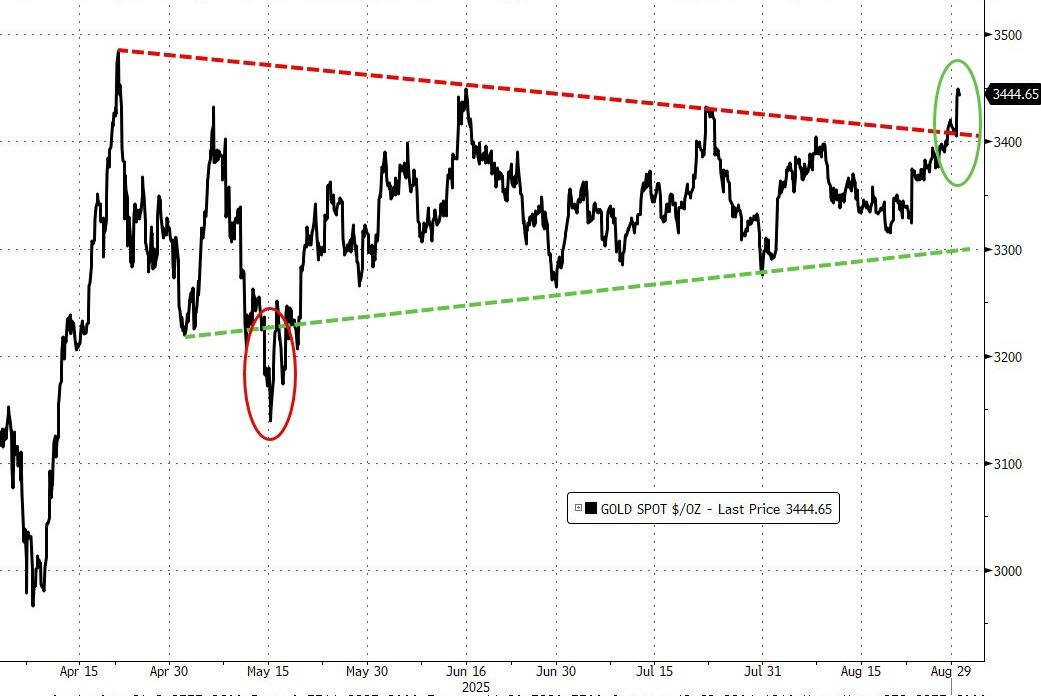
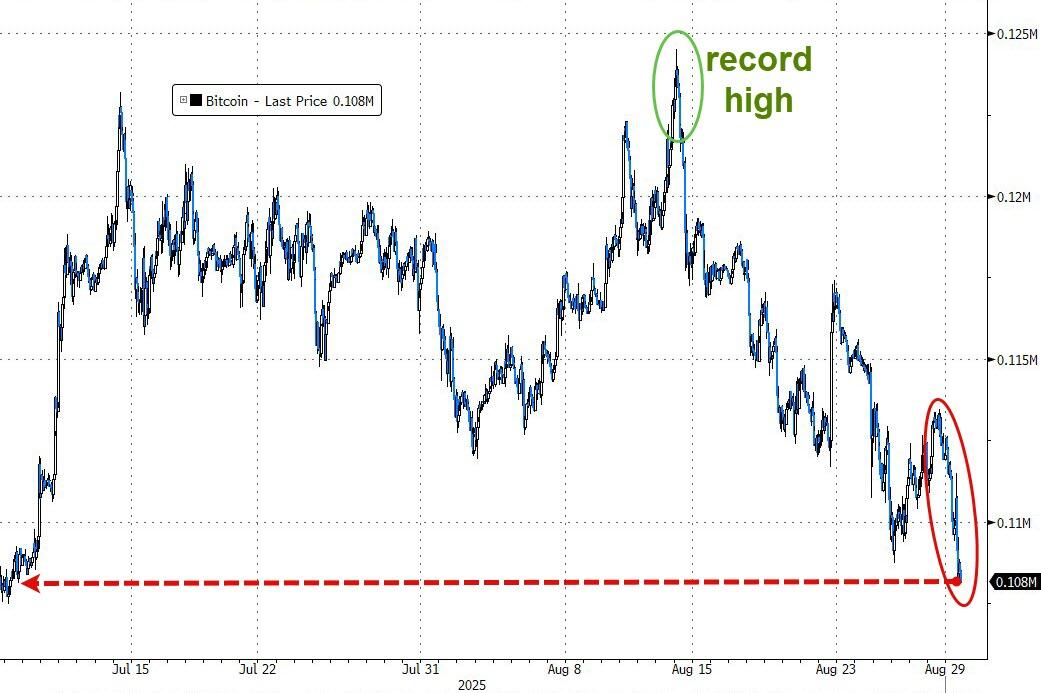
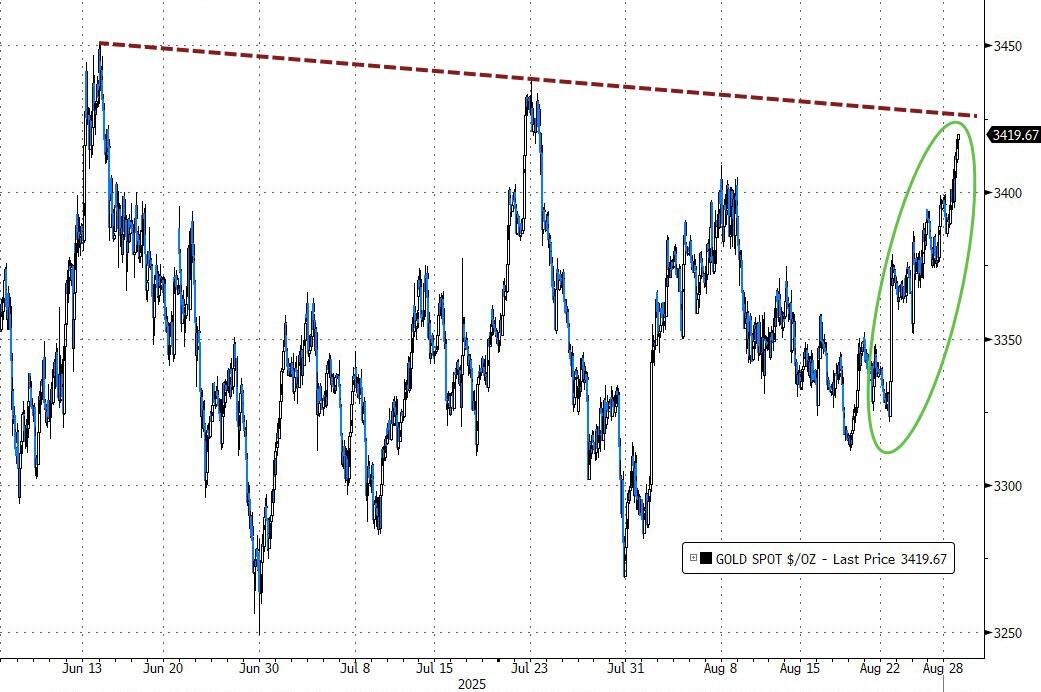
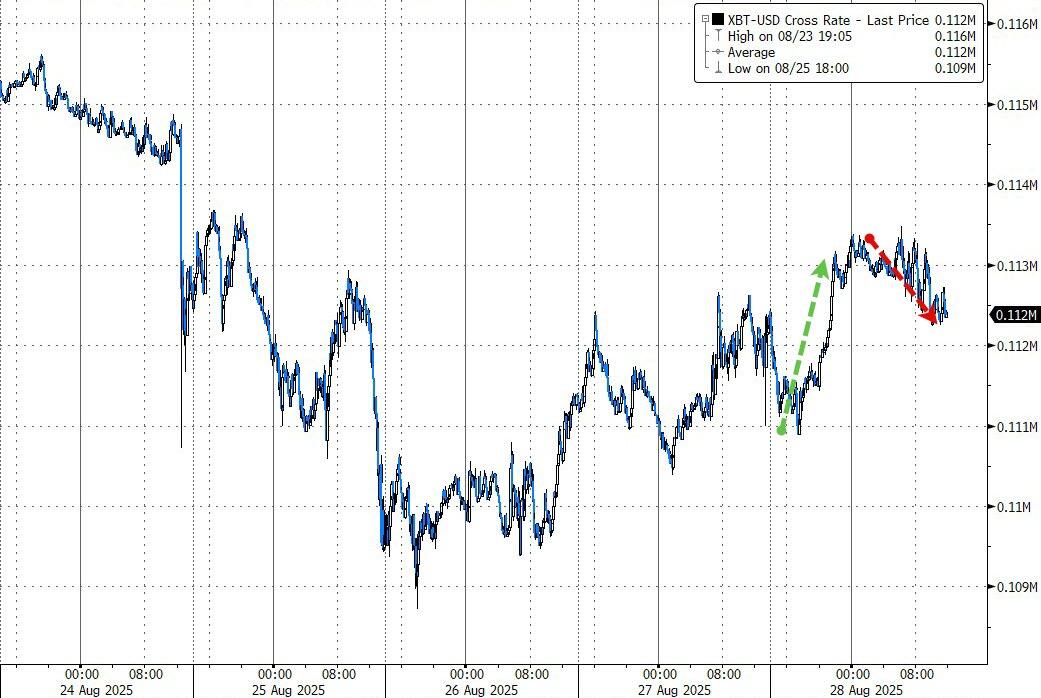
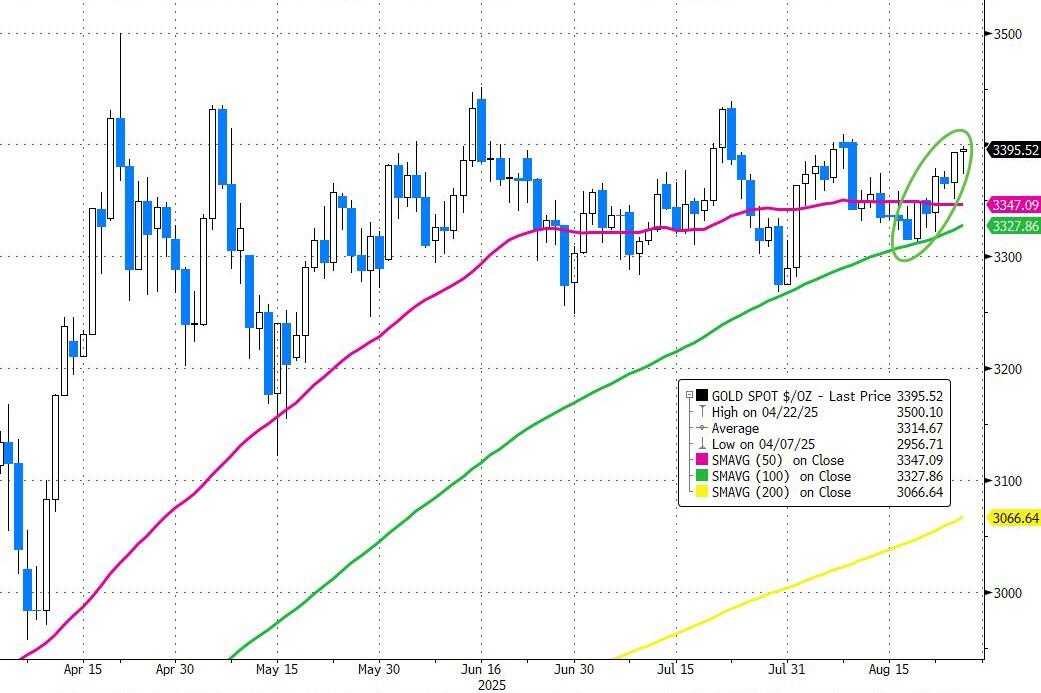
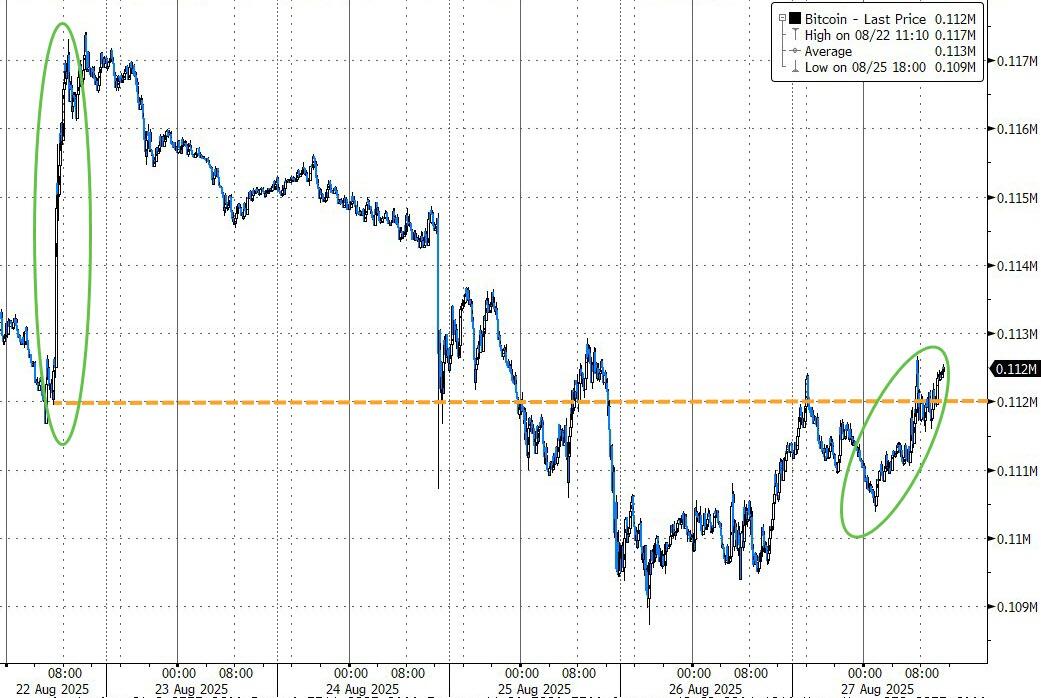
On a brighter note, the way I see it, things looked much better if you were invested in gold, silver, copper, or bitcoin—all of which rallied hard, as some of us were fortunate enough to have taken shelter outside of equities.
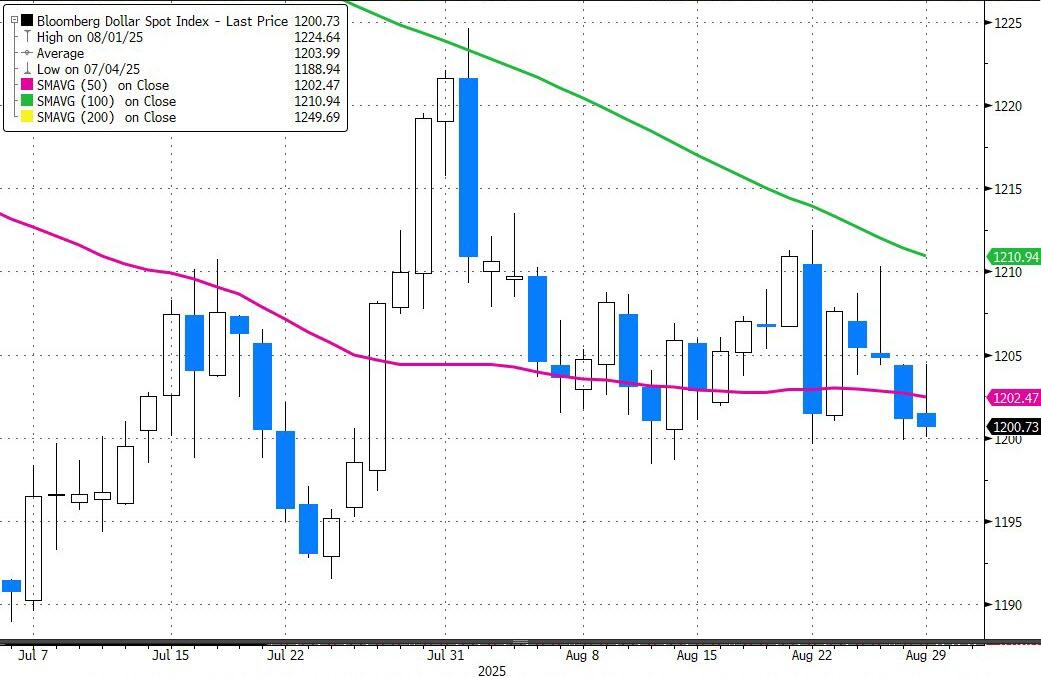
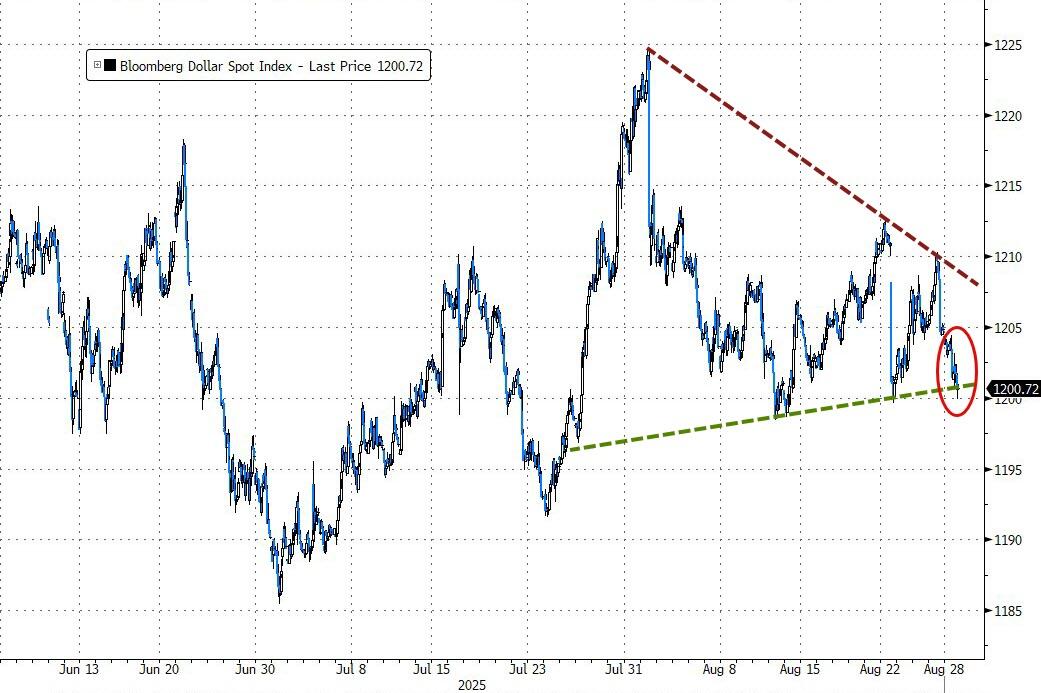
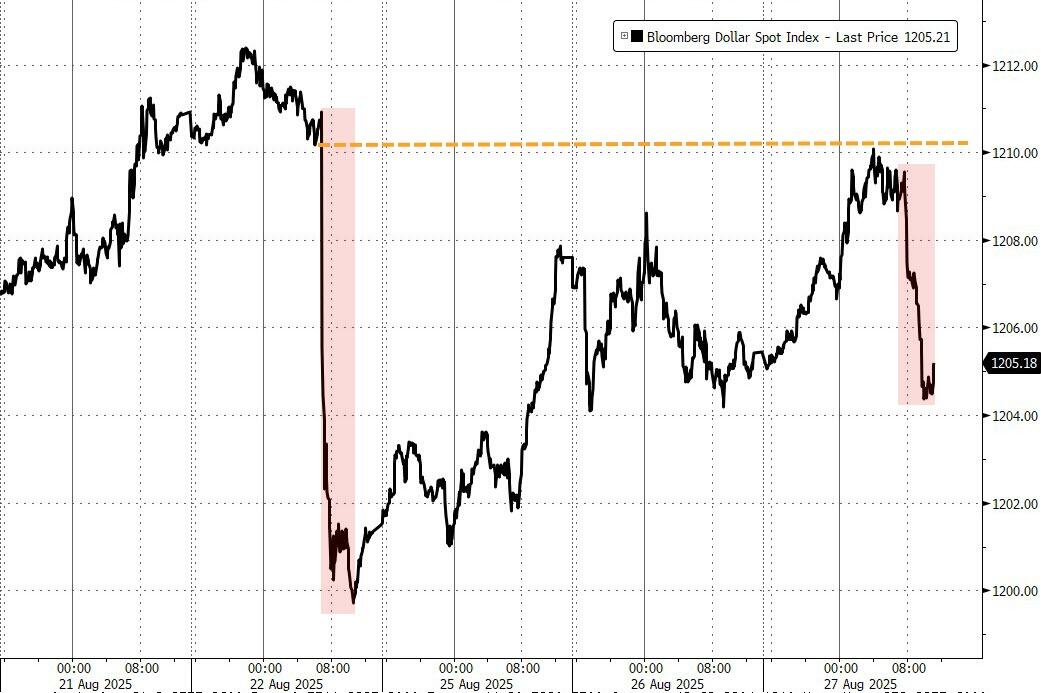
Gold hit a new all-time high, silver jumped 2.7%, copper rallied 1.2%, and bitcoin kept its uptrend alive. Even the dollar got a little bounce, defying recent weakness and hinting that traders were hunting for safer ground.
I believe the next big focus—for both traders and the Fed—is Friday’s jobs report, since it could tip the scales for the mid-month interest rate decision.
Will this bout of market turbulence turn out to be just another brief scare, or is September shaping up to be as tough as history suggests?
Read More