
ETF Tracker StatSheet
You can view the latest version here.
GOLD PAUSES, YIELDS STEADY AS STOCKS SOAR

- Moving the market
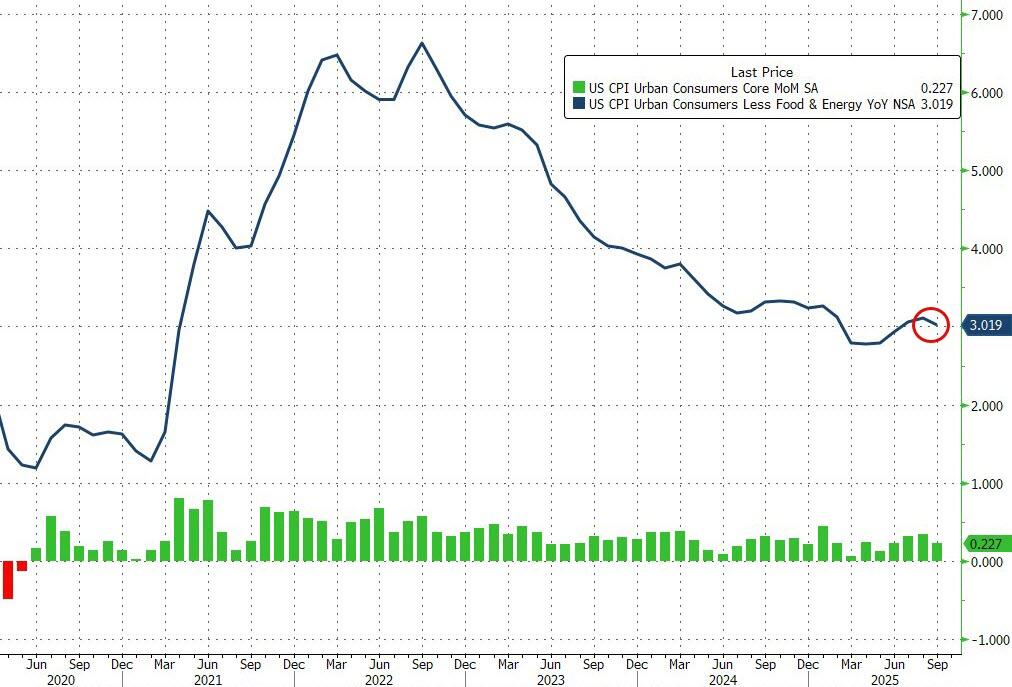
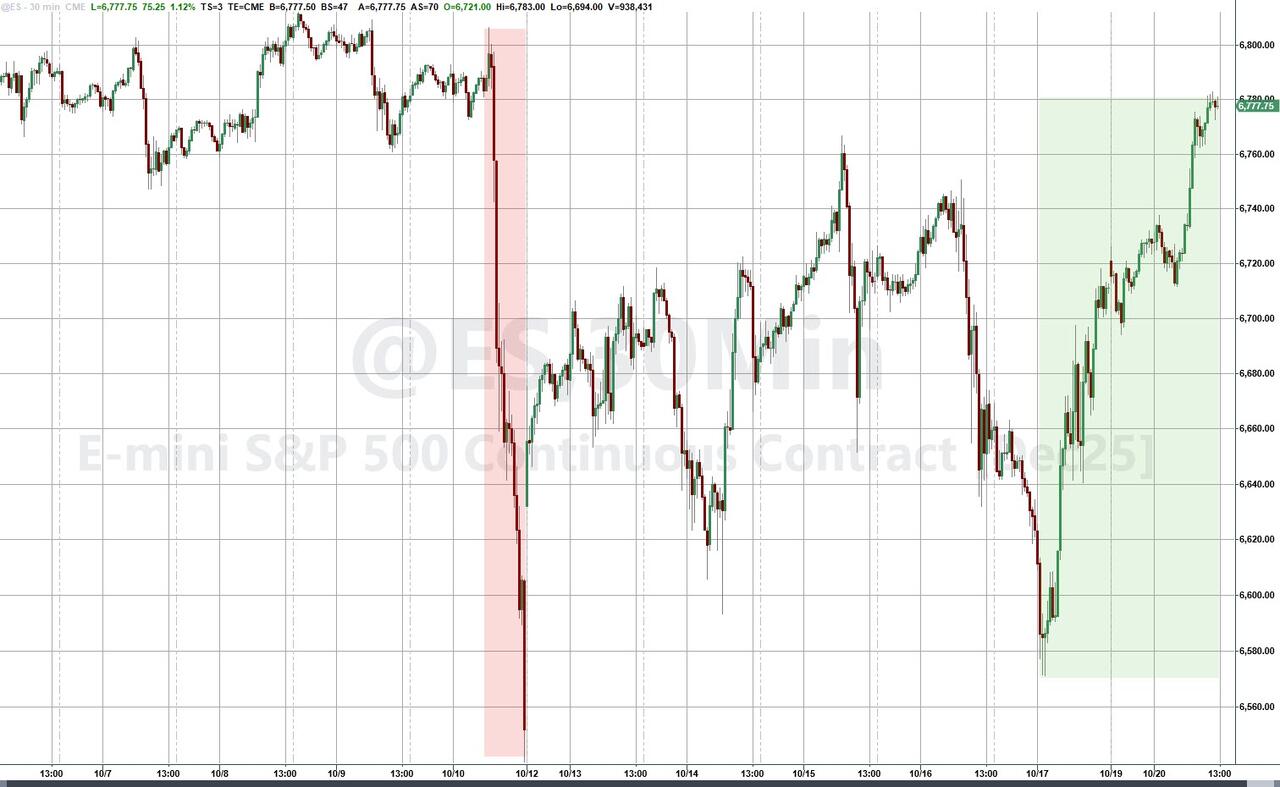
Stocks hit new highs Friday after cooler-than-expected inflation data boosted hopes the Federal Reserve can stay on its rate-cutting path and keep the soft-landing story alive.
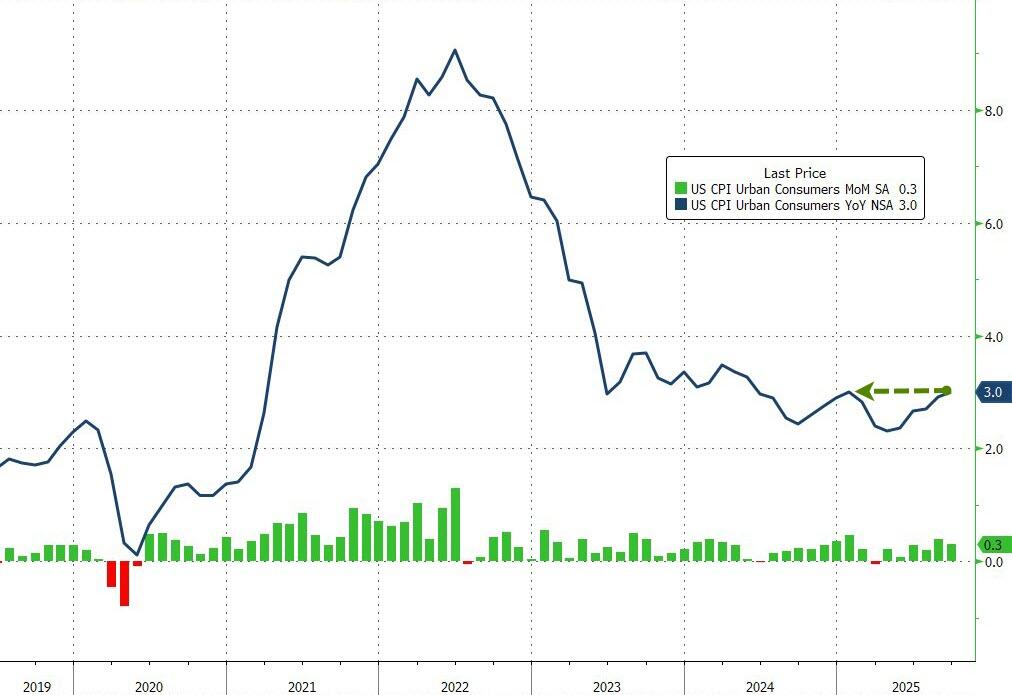
The September CPI report showed prices rose 0.3% month-over-month and 3% year-over-year—both slightly below forecasts—while core inflation, excluding food and energy, climbed just 0.2% for the month and 3% over the year.
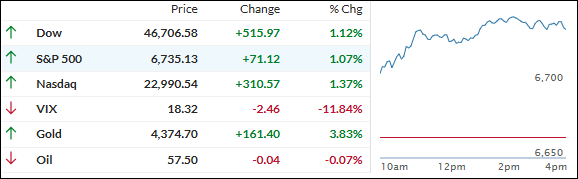
The data gave traders confidence that the Fed’s easing cycle is on track, with market odds now fully pricing in rate cuts at both remaining meetings this year. Investors cheered the news, sending the S&P 500 and Nasdaq to fresh records and even pushing the Dow closer to another milestone.
Positive earnings surprises added to the good vibes. Intel surged 5% after reporting quarterly revenue above expectations, helped by strong AI chip demand. Procter & Gamble gained more than 1% after beating Wall Street’s forecasts for both earnings and revenue, saying consumer demand remains resilient despite higher costs.
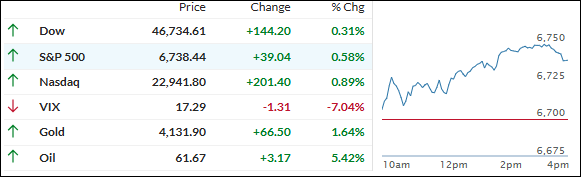
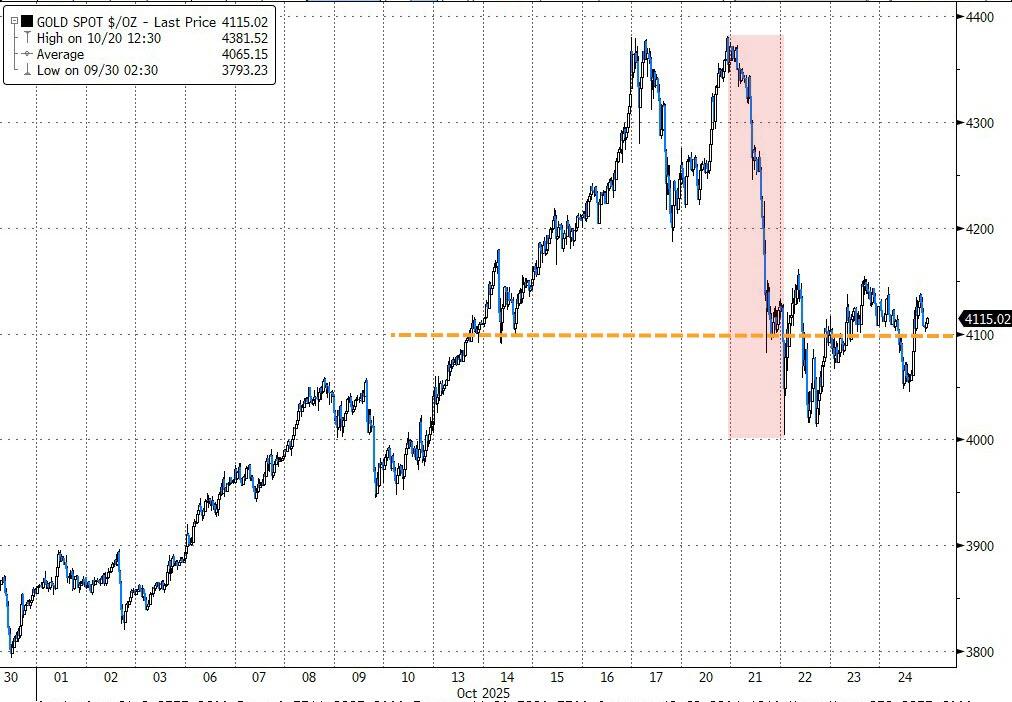
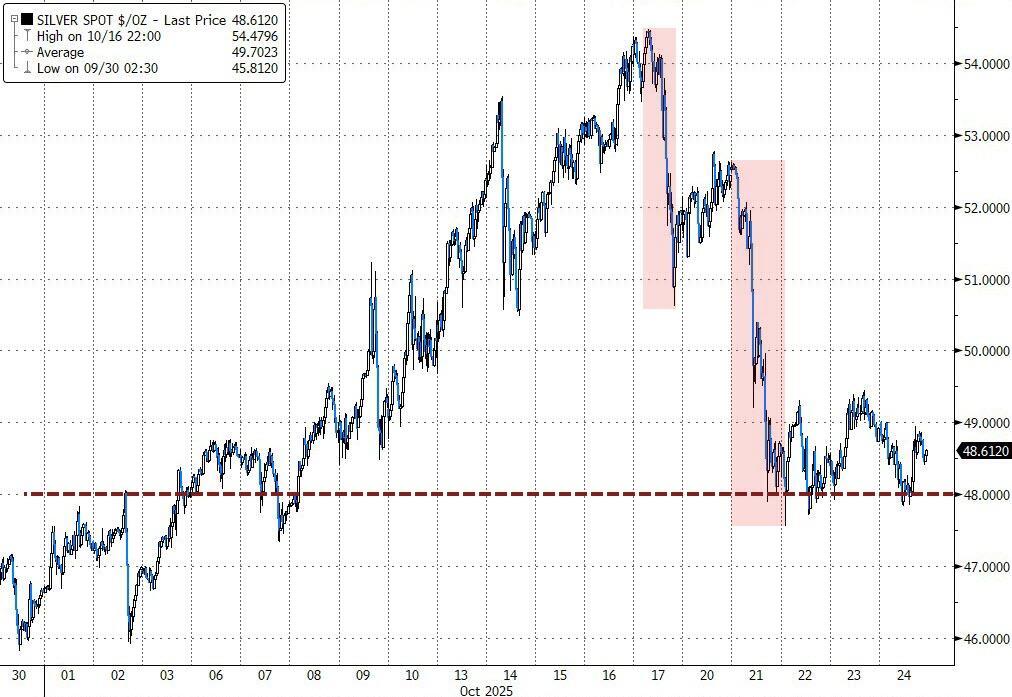
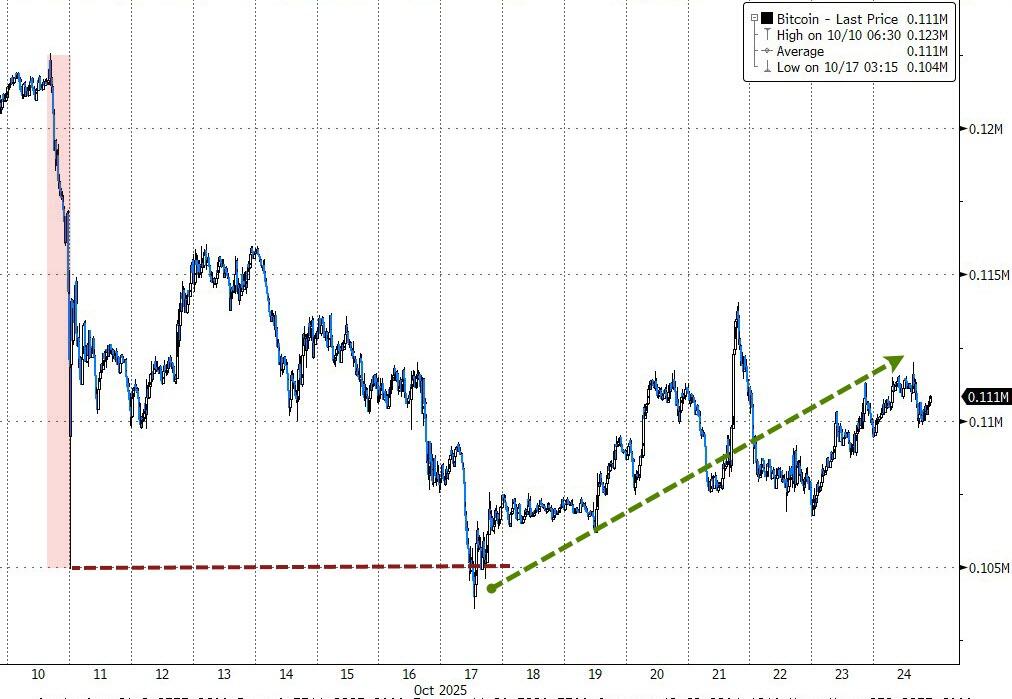
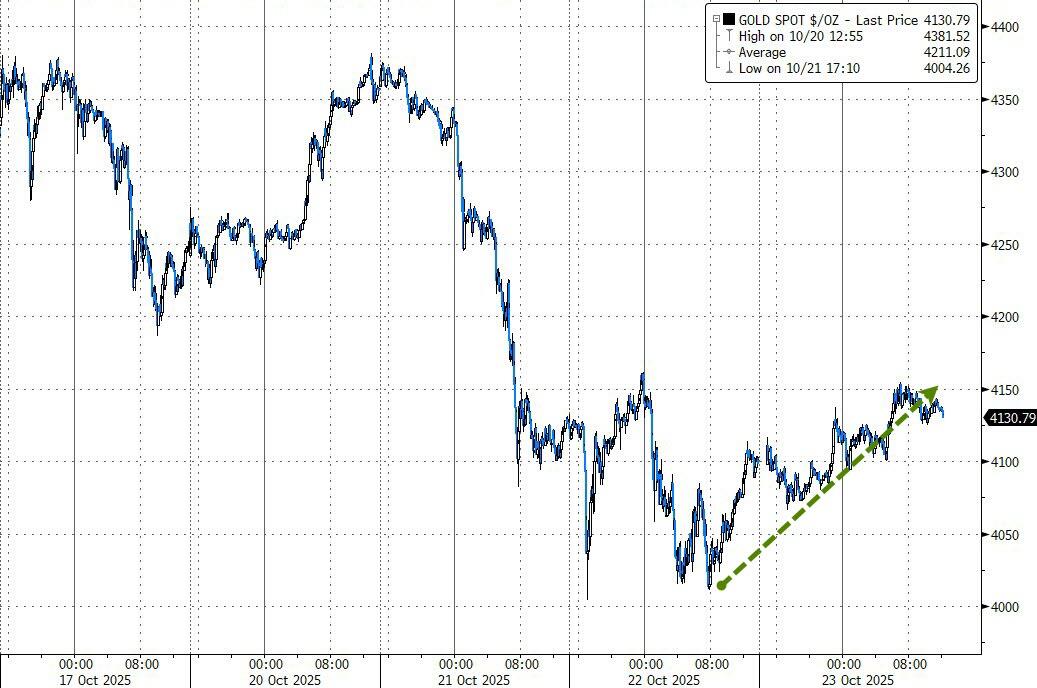
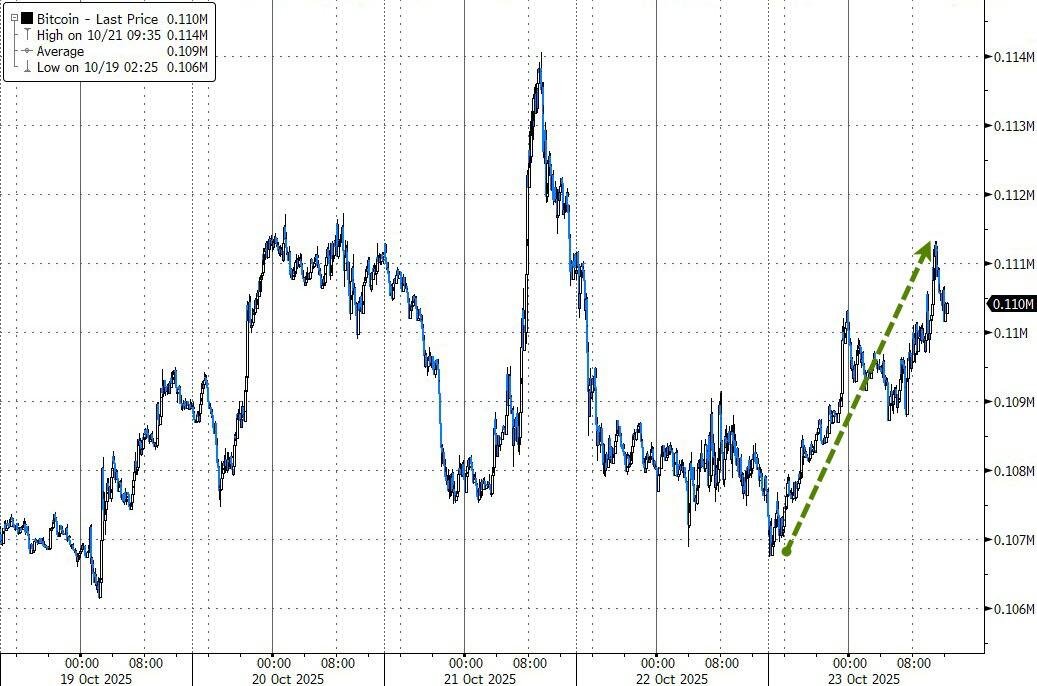
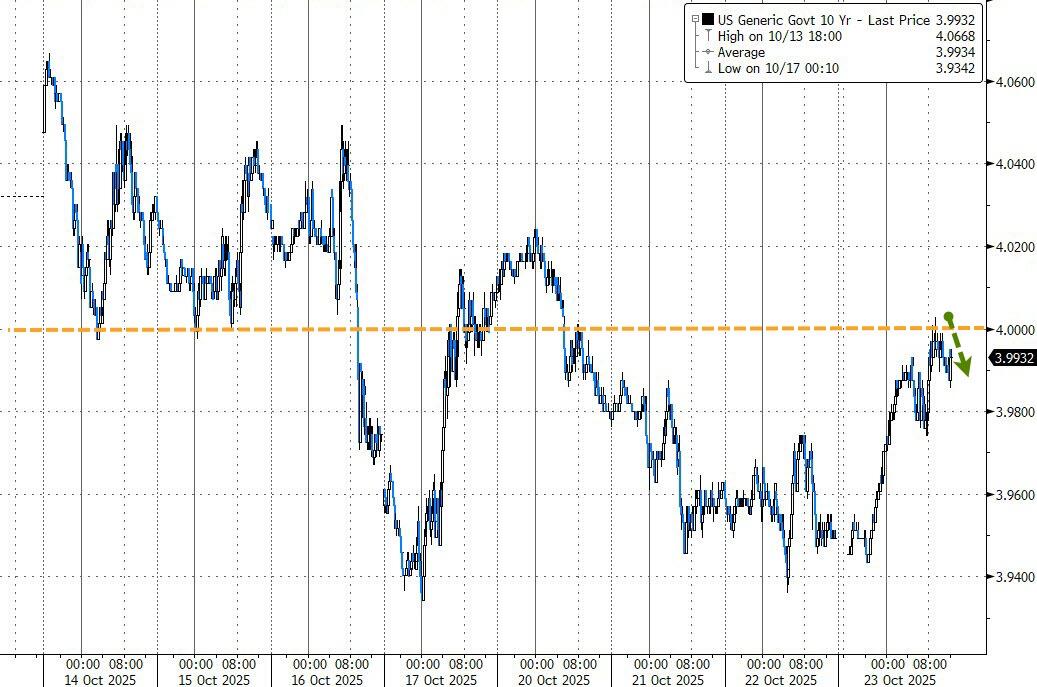
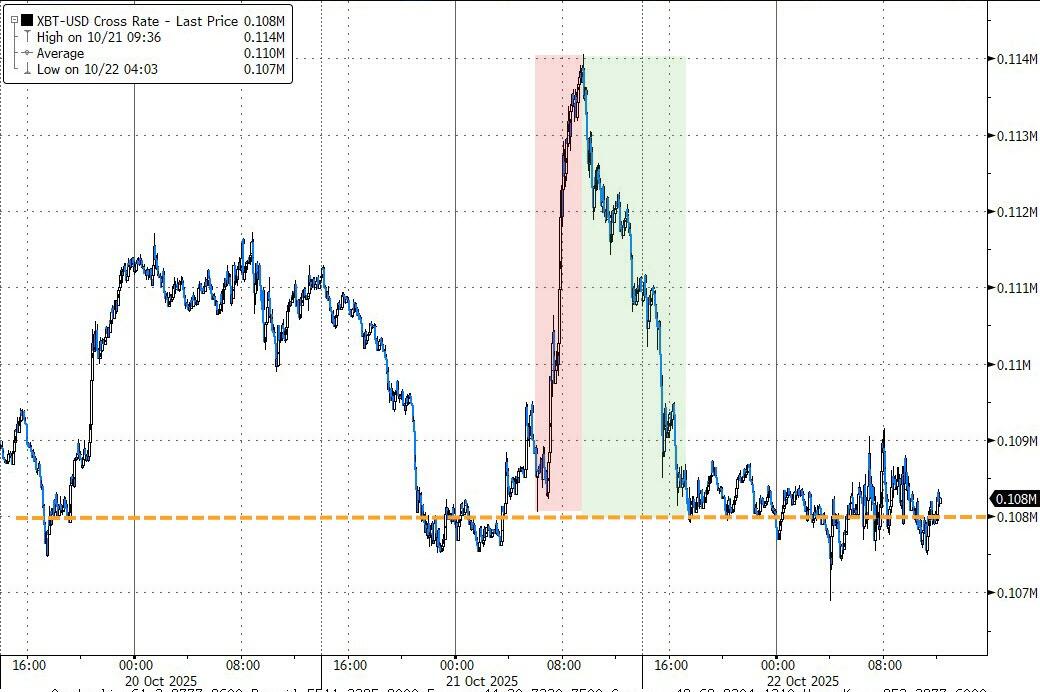
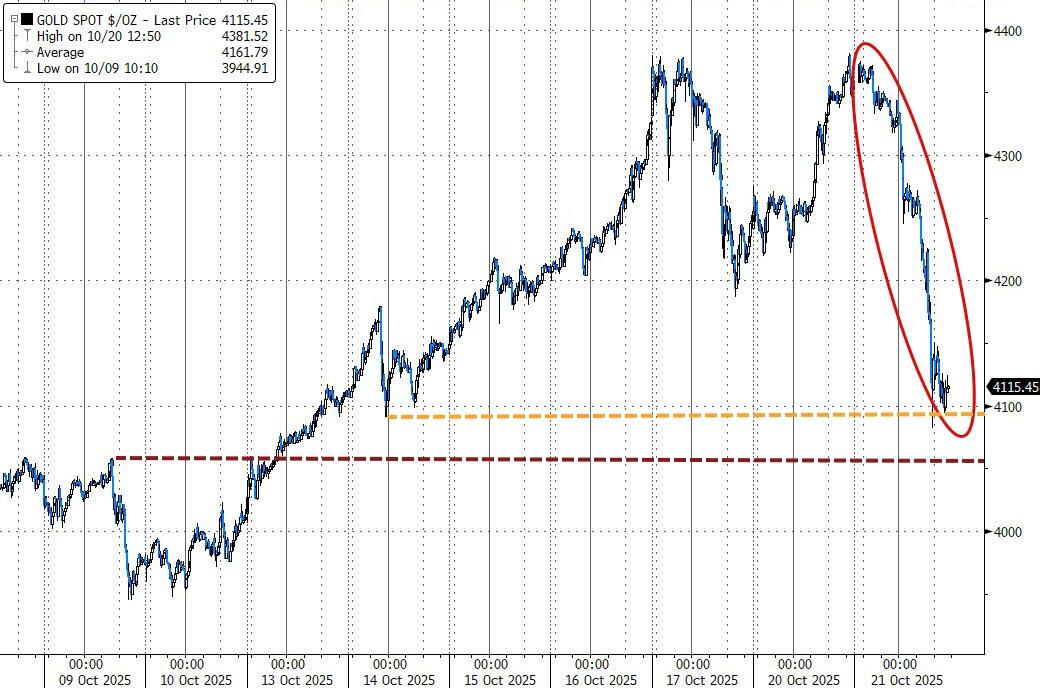
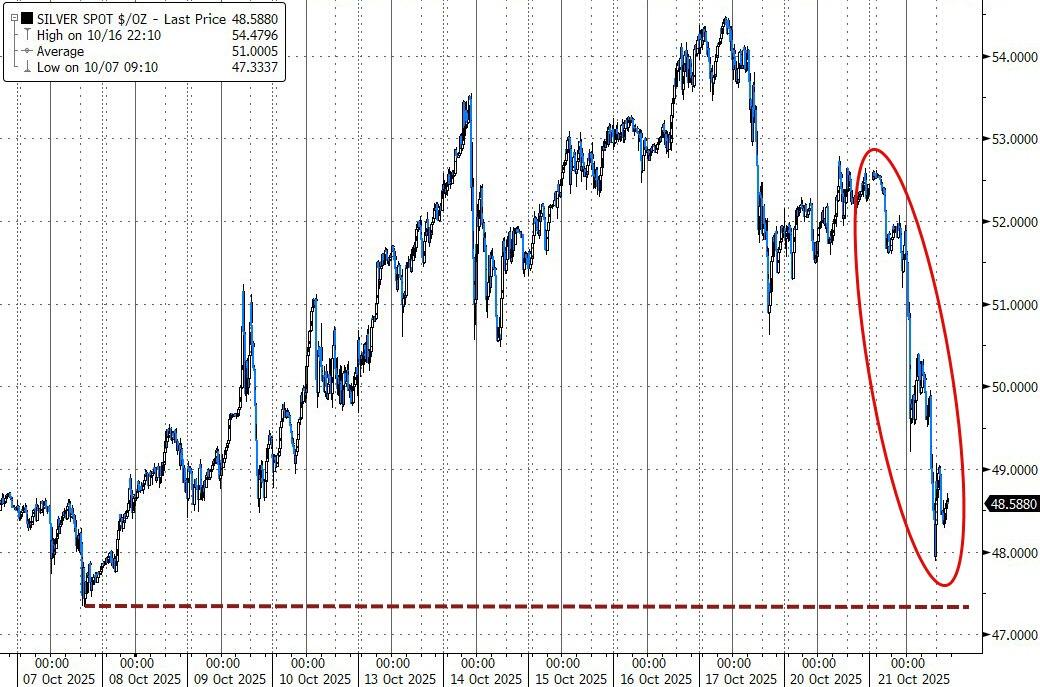
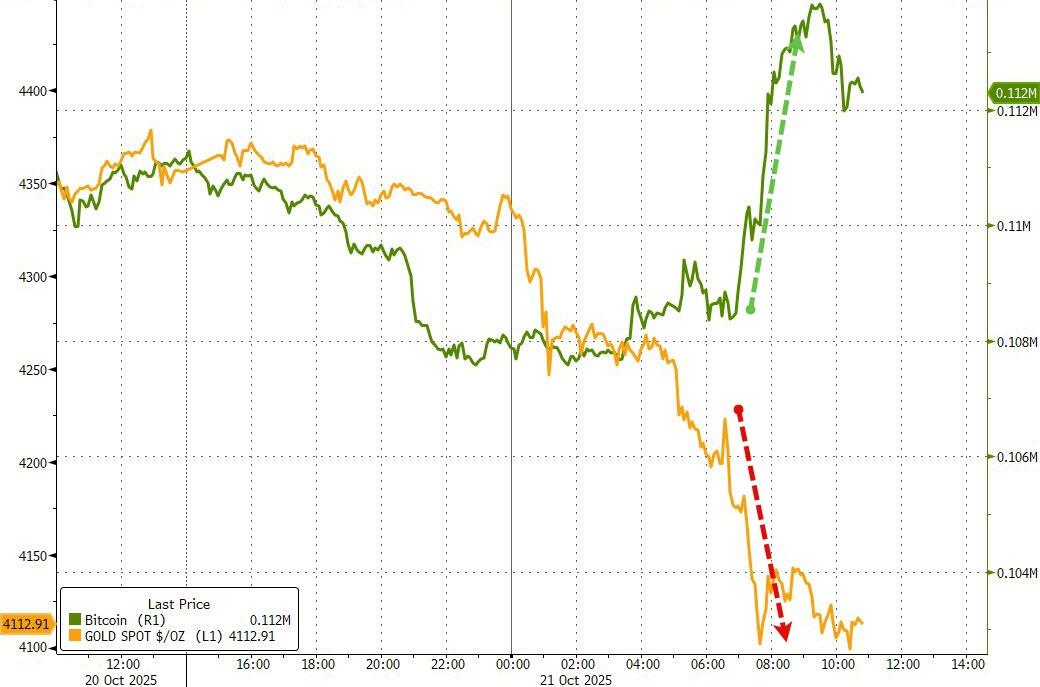
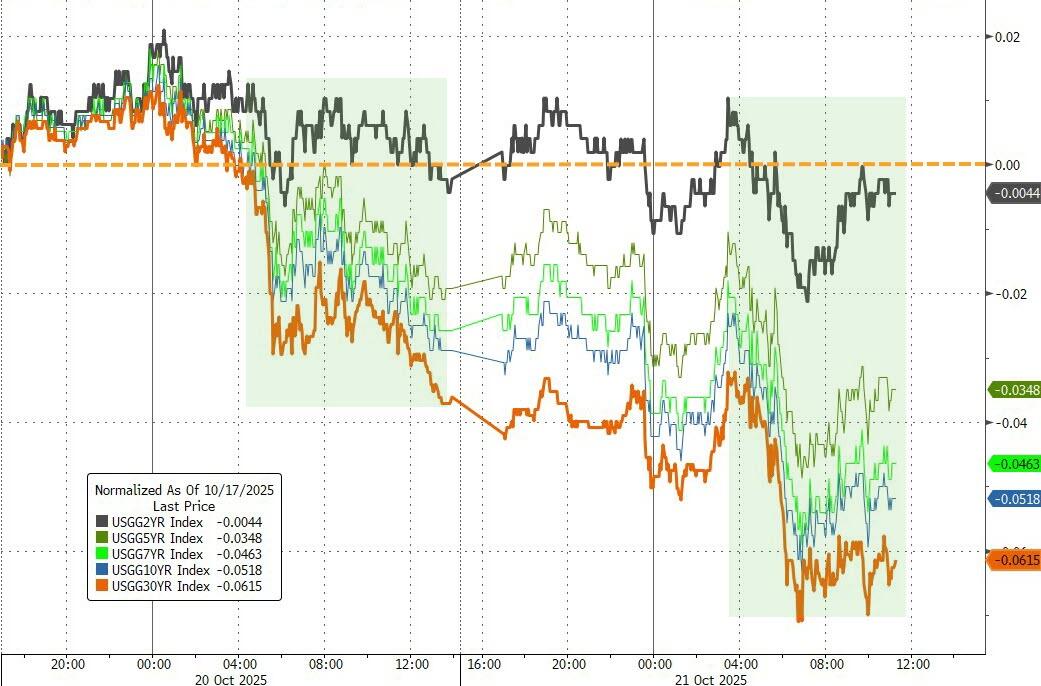
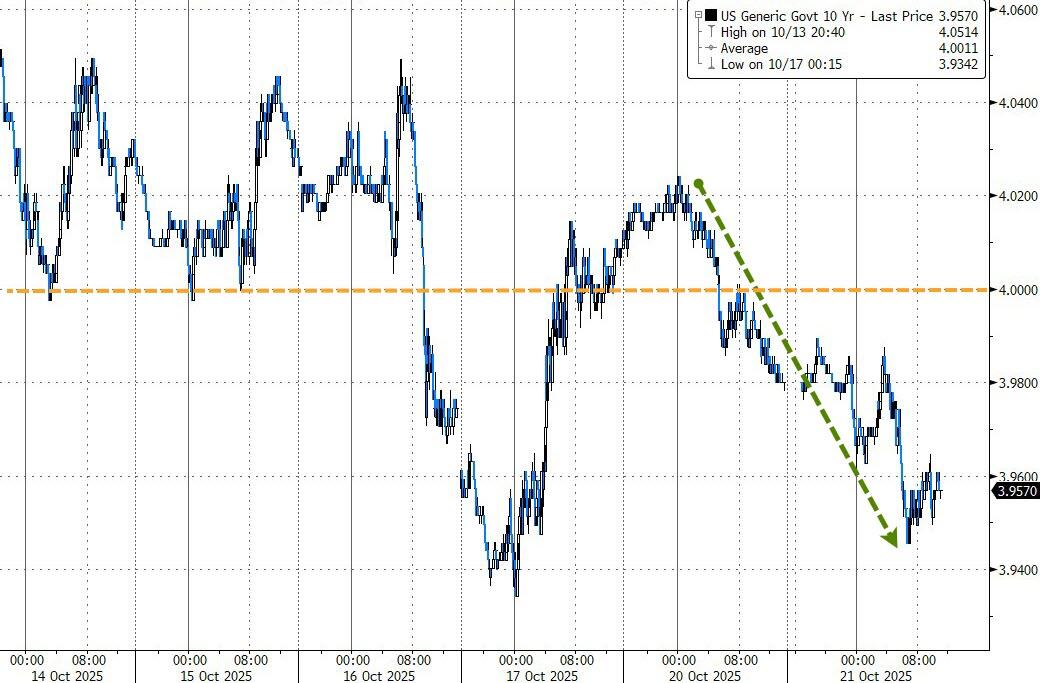
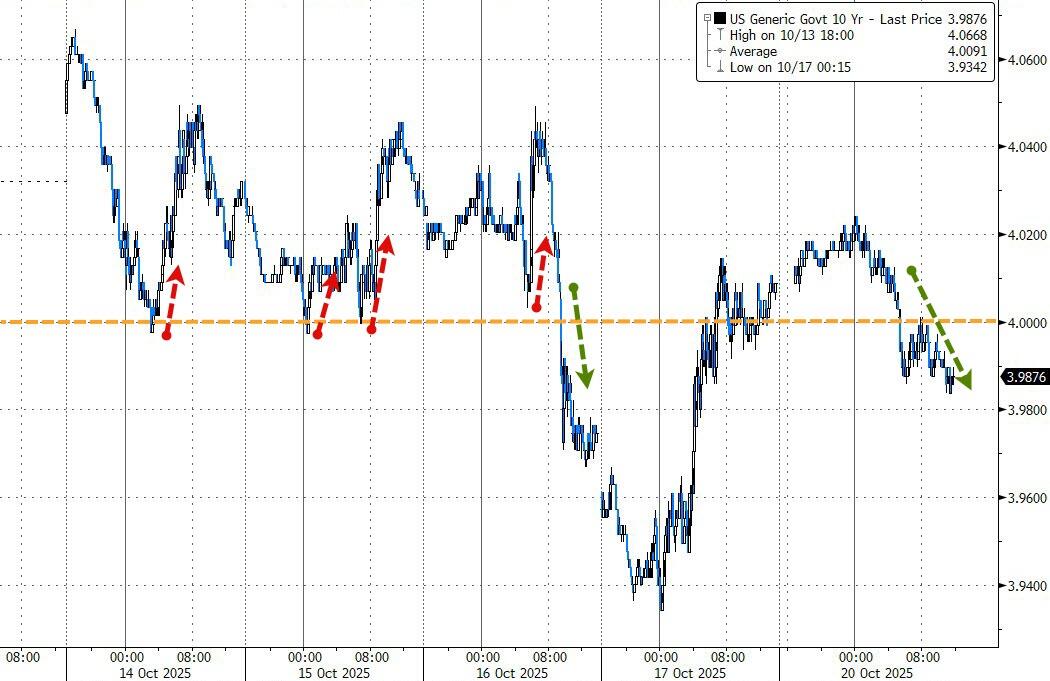
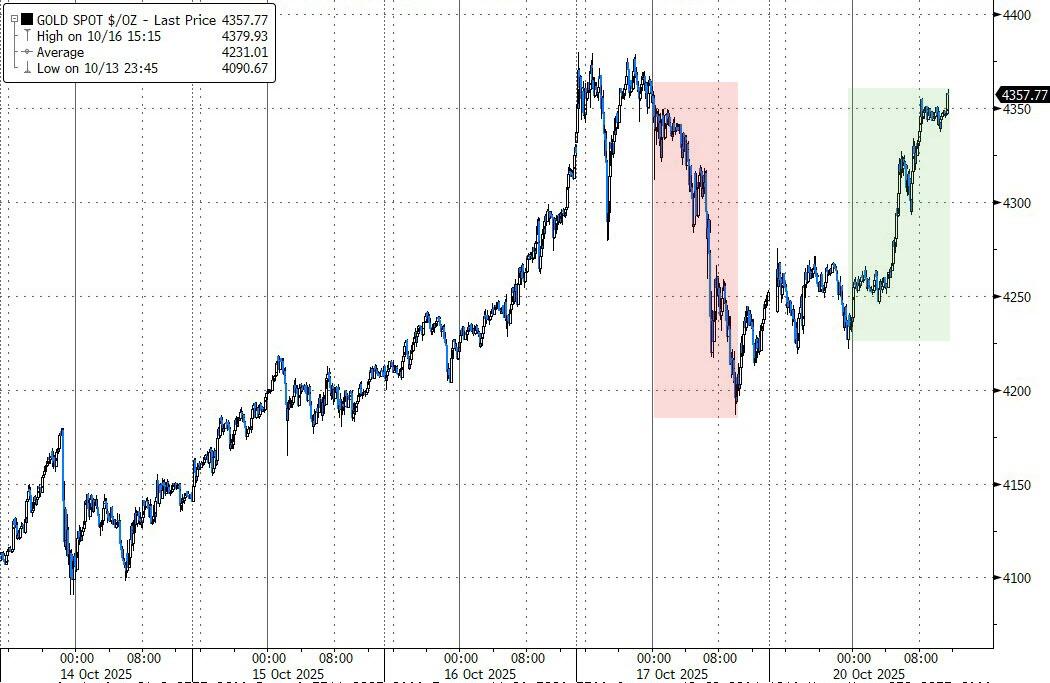
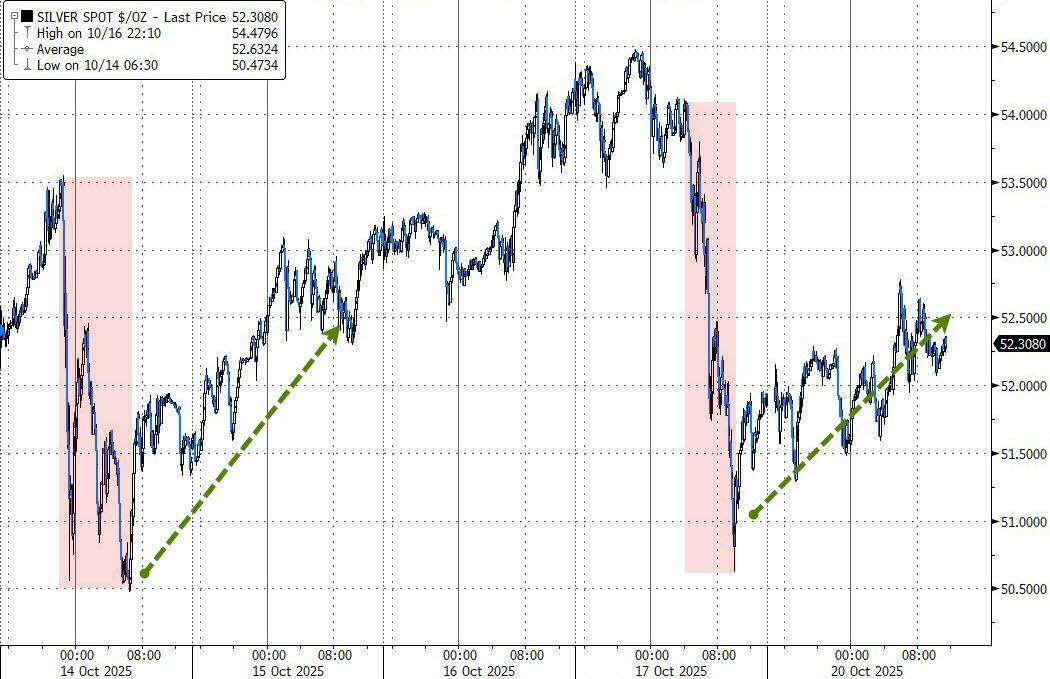
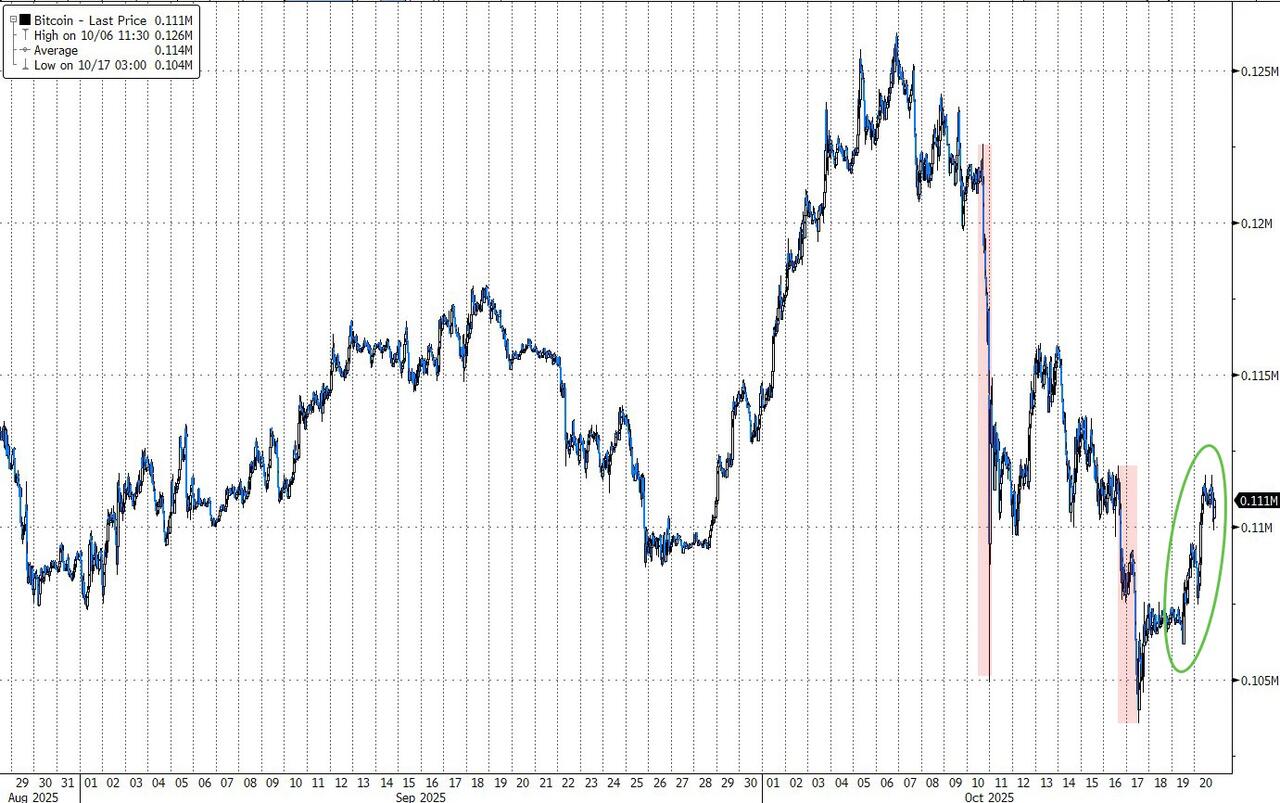
Gold cooled off after a nine-week winning streak but held solidly above $4,100, and silver found support near the $48 mark. Bond yields were mixed, with the 10-year Treasury hovering around 4%, while Bitcoin extended its weekly rebound toward $111,000.
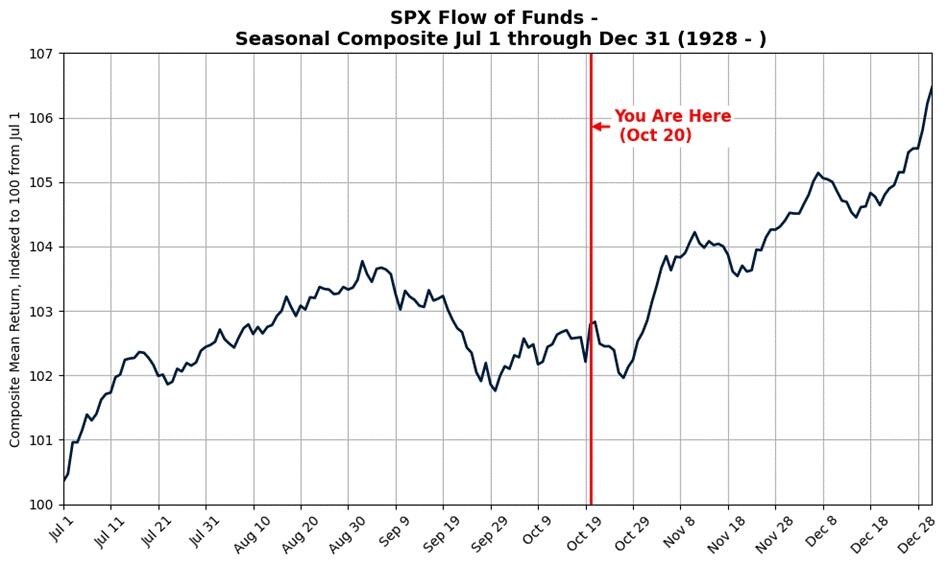
Looking ahead, seasonal trends suggest the market could stay strong through year-end—but will that historical pattern hold up this time, or will inflation and politics throw another twist into the mix?
Read More

