
- Moving the market
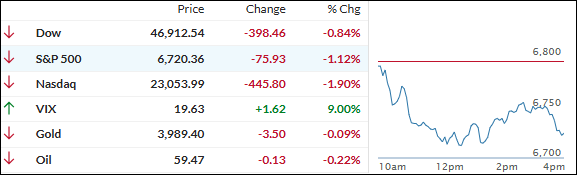
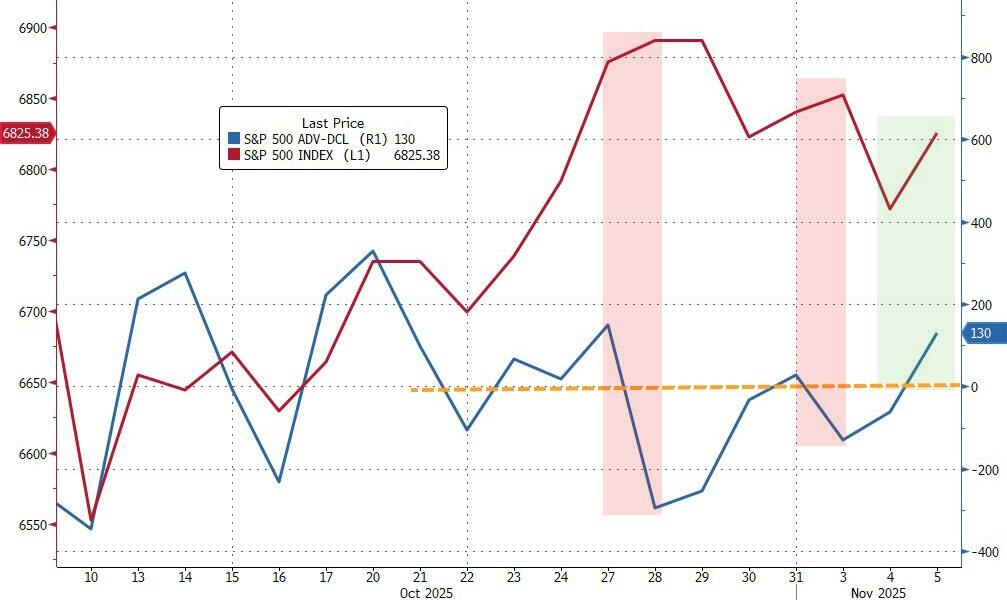
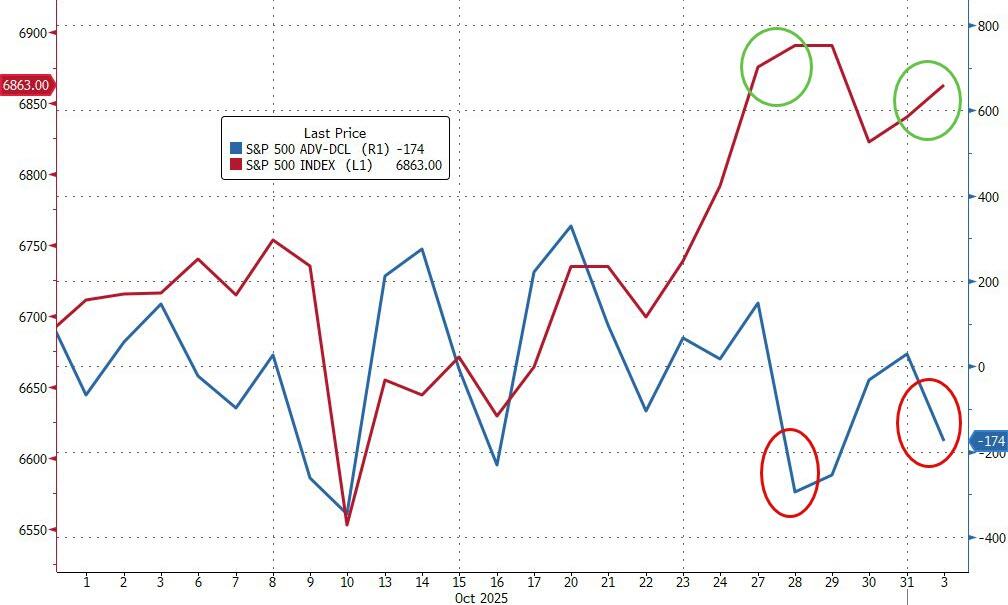
Stocks took a hit today, with the sell-off gaining steam as the session wore on. The usual suspects in the AI space were under pressure again, as investors grew increasingly uneasy about sky-high valuations.
Adding fuel to the fire were fresh concerns about the job market. October saw a wave of layoff announcements—over 153,000 job cuts, to be exact. That’s a whopping 183% jump from September and the worst October for layoffs in 22 years. In fact, 2025 is shaping up to be the roughest year for job losses since the 2009 recession.
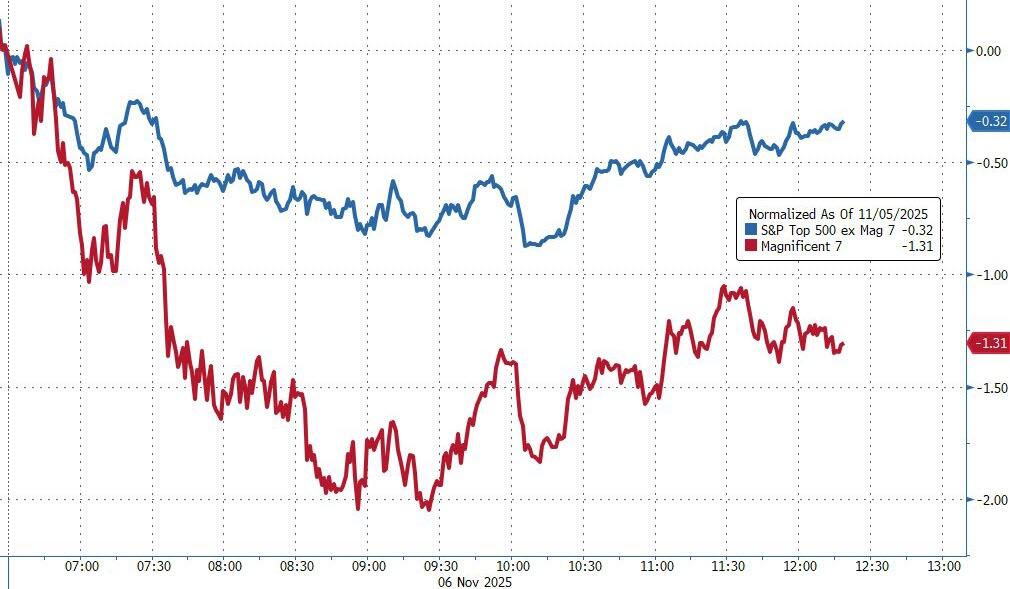
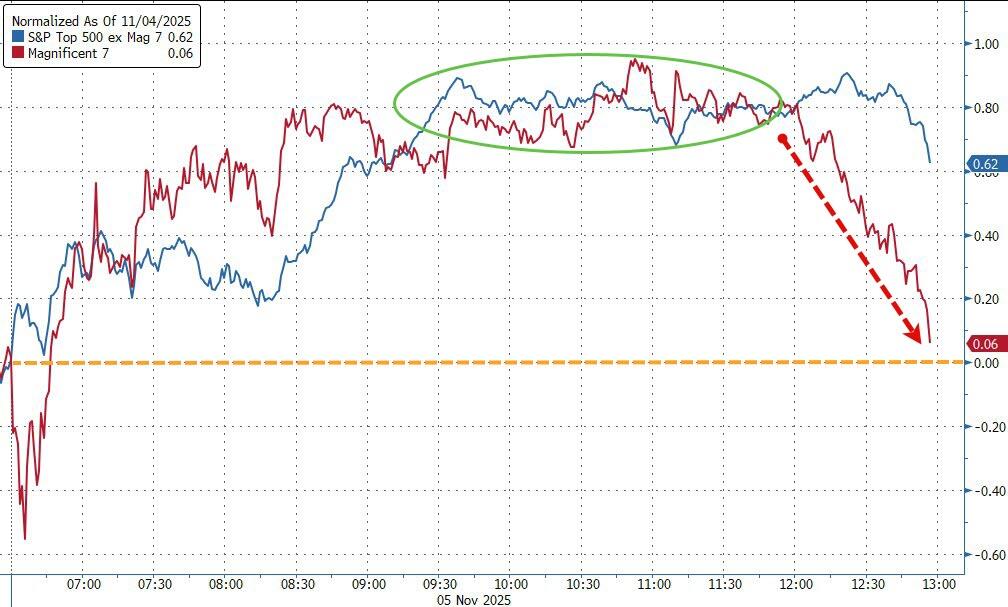
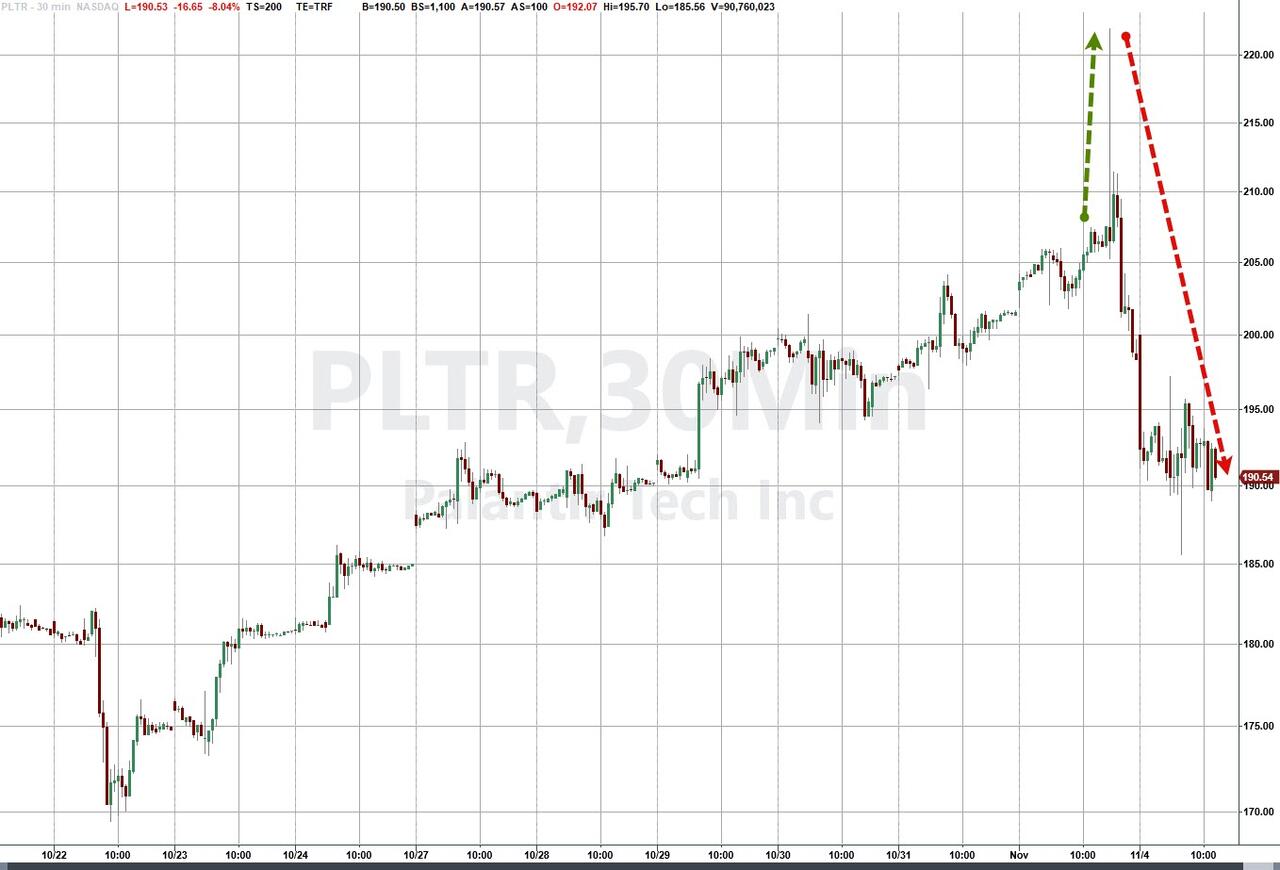
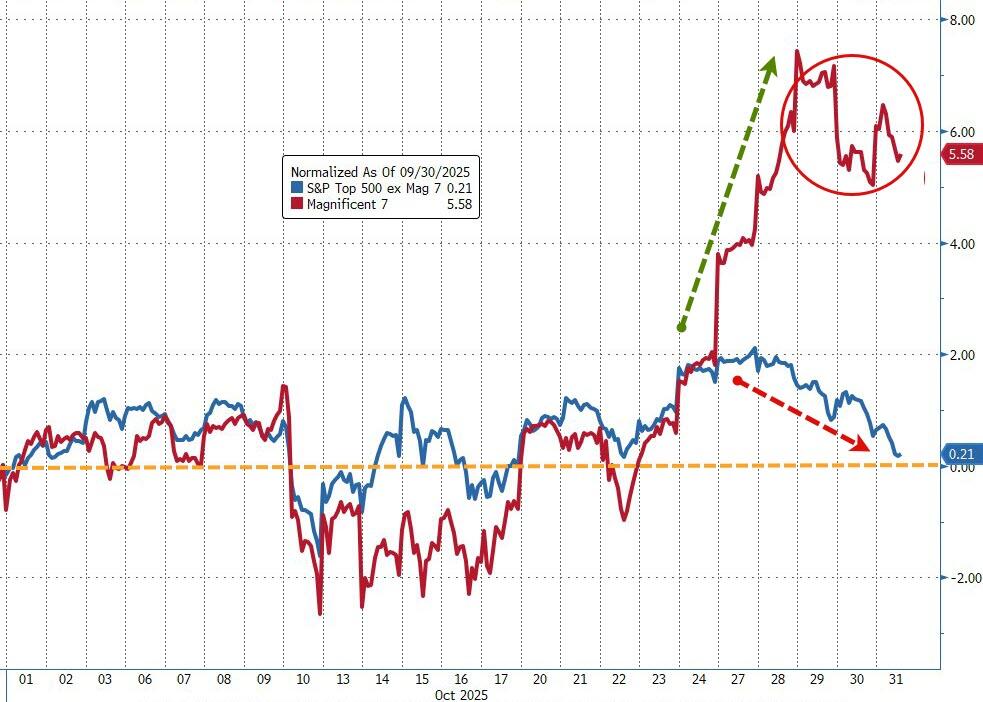
AI stocks stayed in the spotlight. Qualcomm dropped 2%, despite beating earnings expectations. AMD, which had a strong showing yesterday, gave back 5%. Palantir and Oracle slipped 2% and 3%, respectively. Even Nvidia and Meta, two of the “Magnificent Seven,” couldn’t escape the downturn.
Meanwhile, traders kept one eye on Washington, where the Supreme Court is reviewing the legality of tariffs imposed during the Trump administration. Based on the justices’ comments, many expect a ruling that could roll back those trade taxes—potentially a bullish catalyst for stocks down the line.
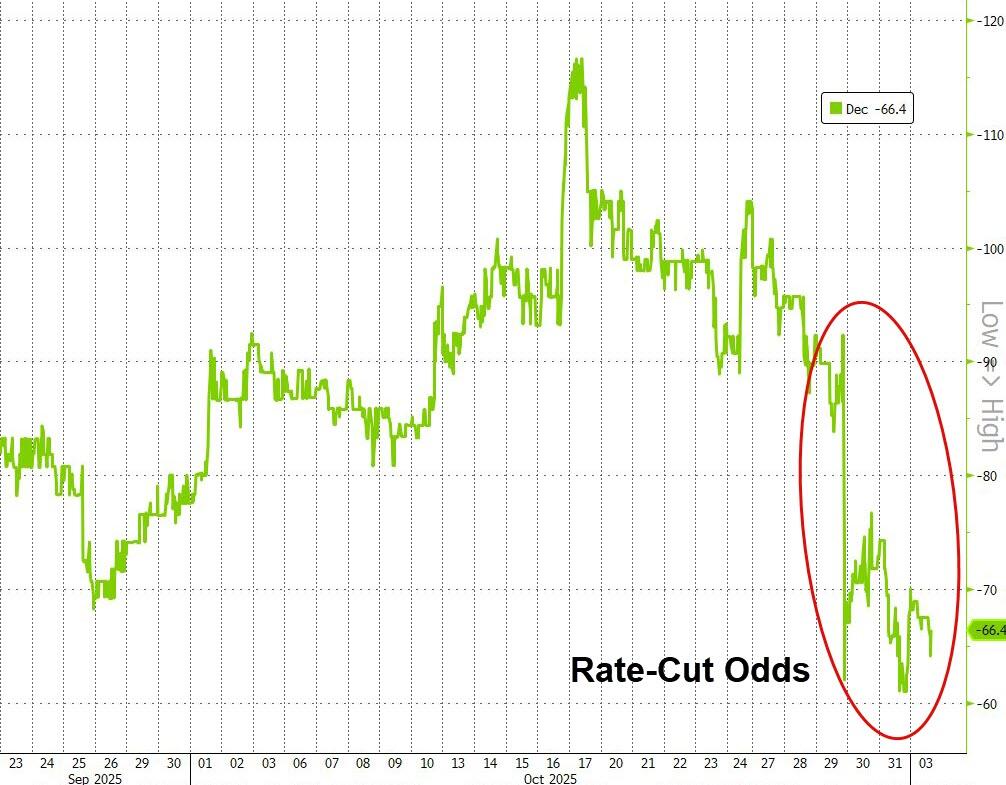
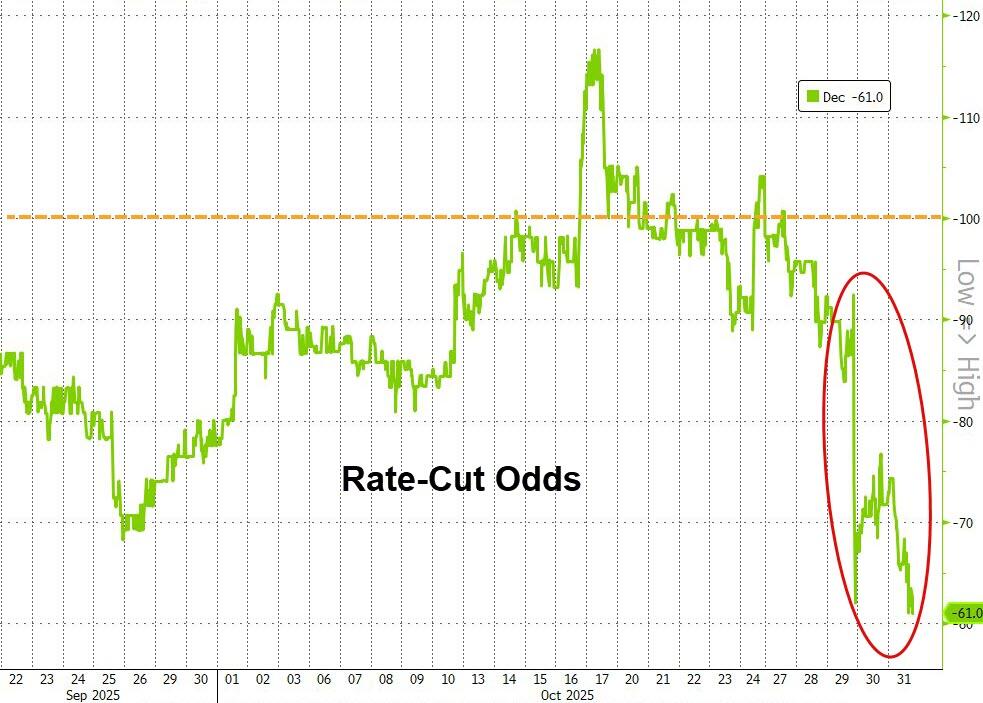
But for now, sentiment stayed sour. Cleveland Fed President Beth Hammack made it clear that inflation is still public enemy number one. She said the Fed should keep tightening the screws to bring prices down, even if it means more pain in the labor market.
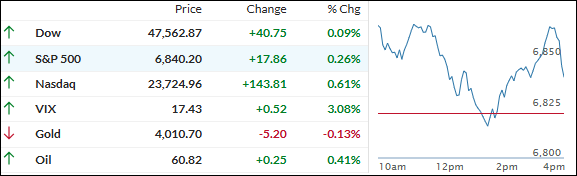
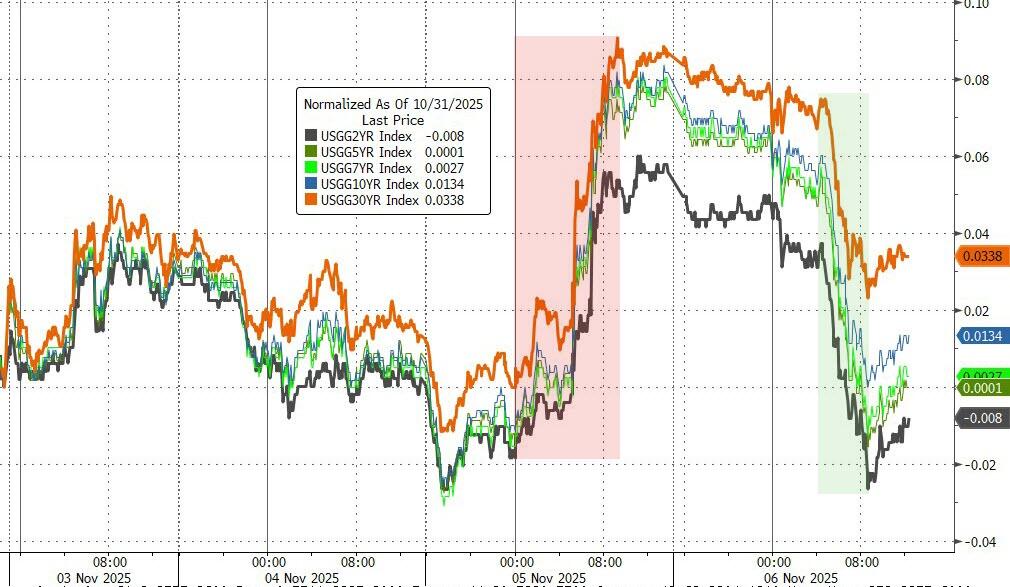
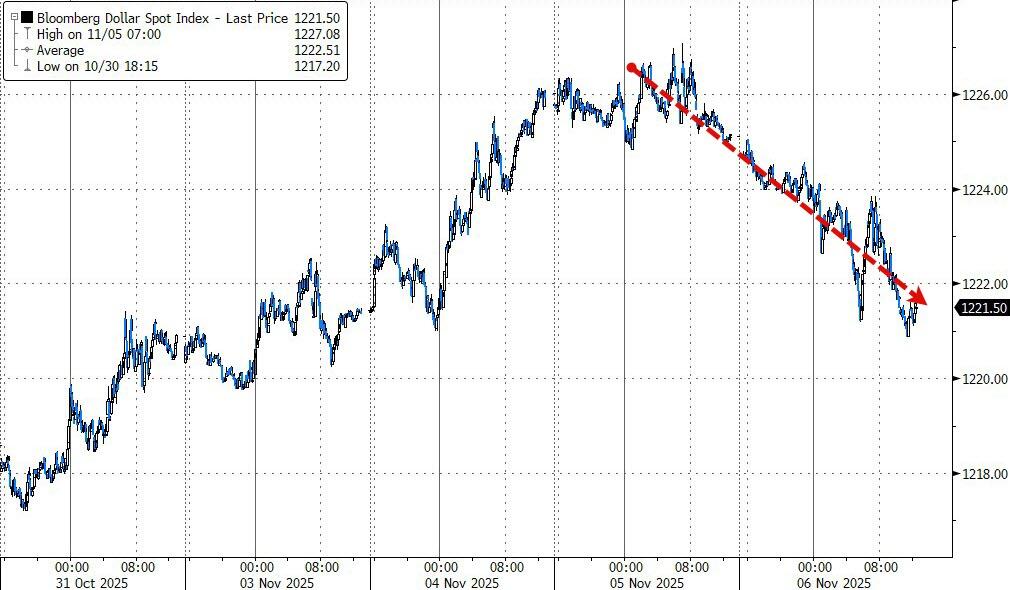
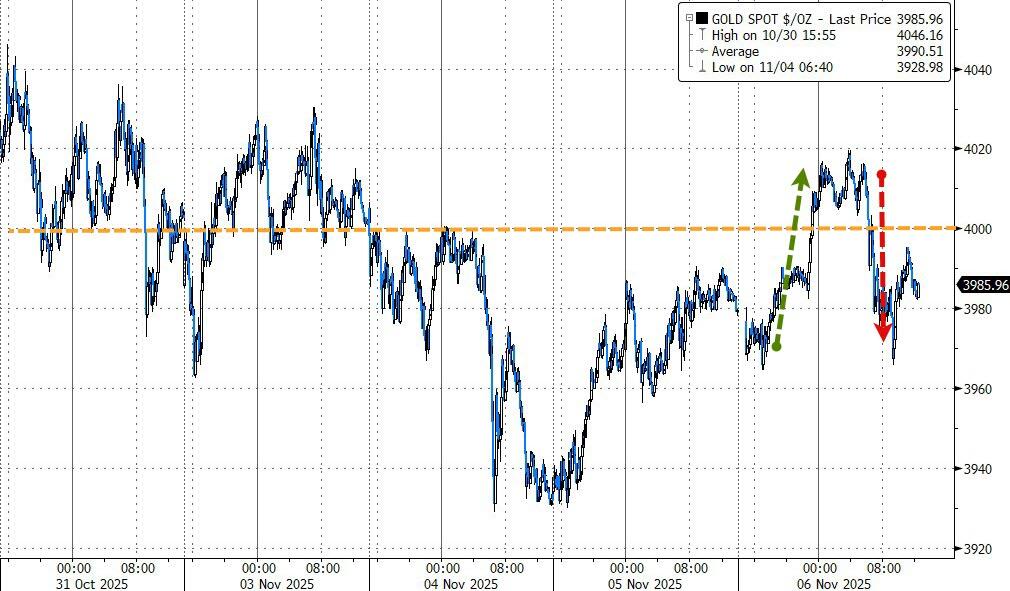
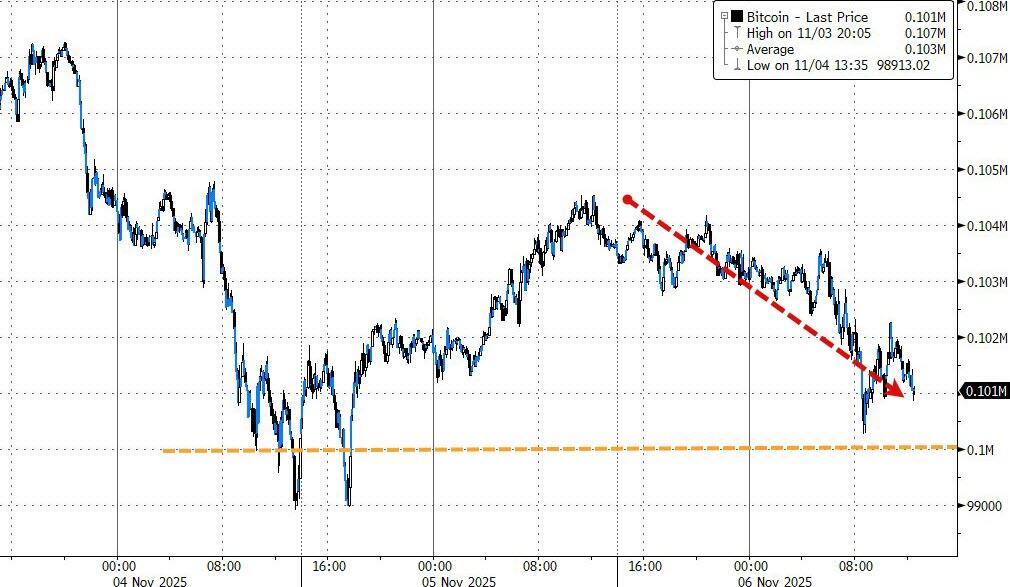
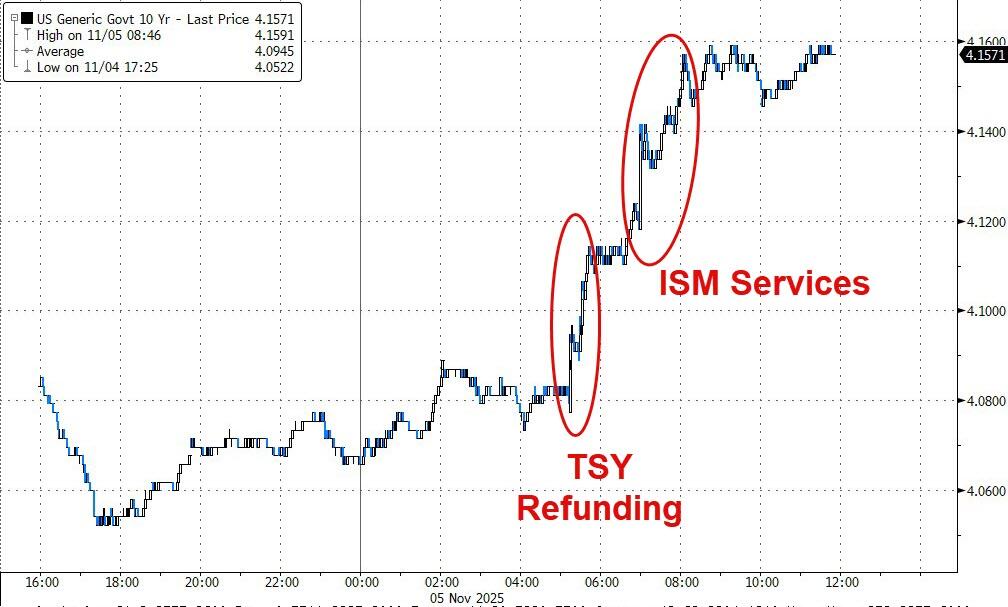
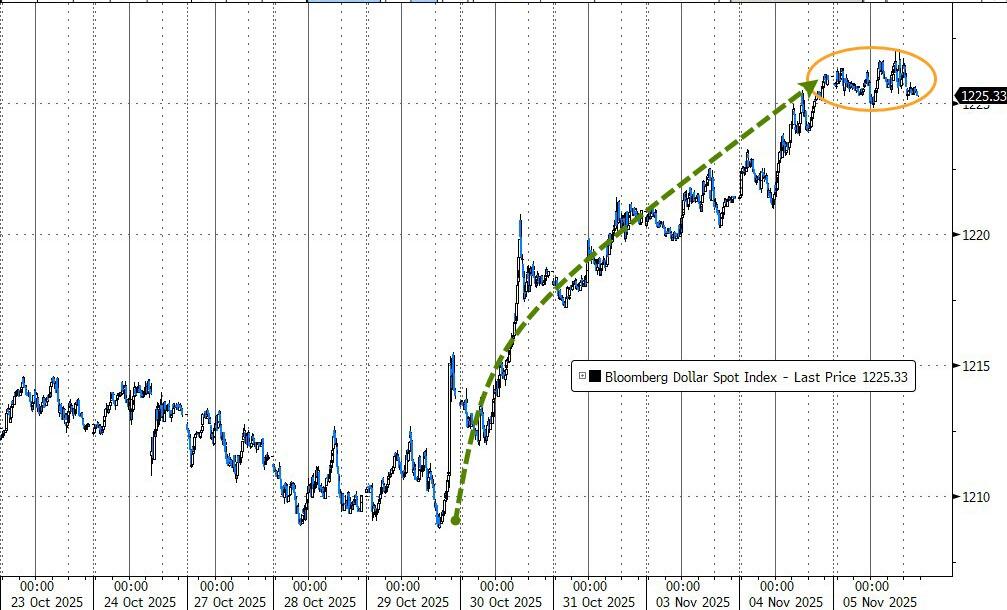
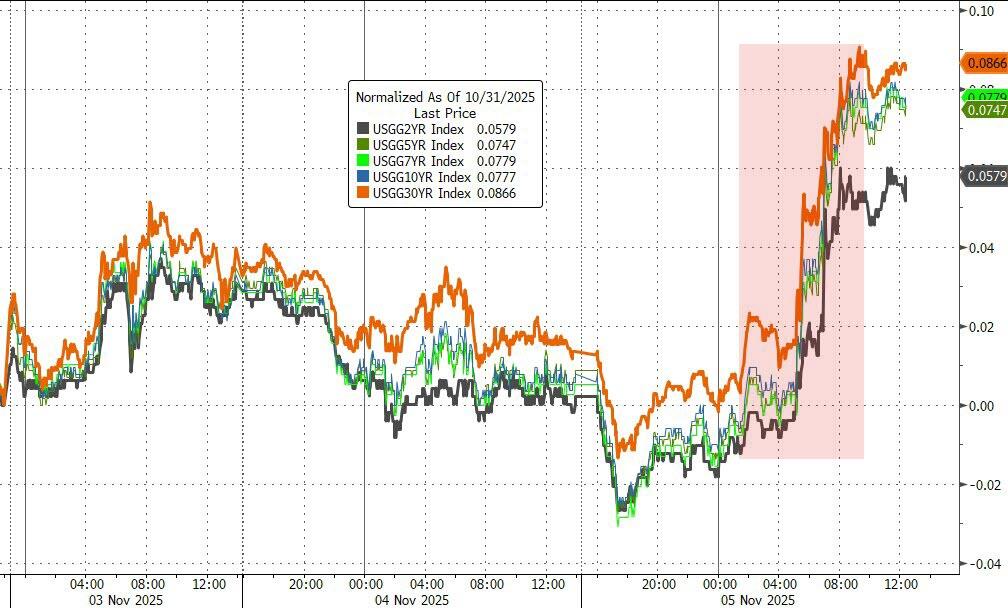
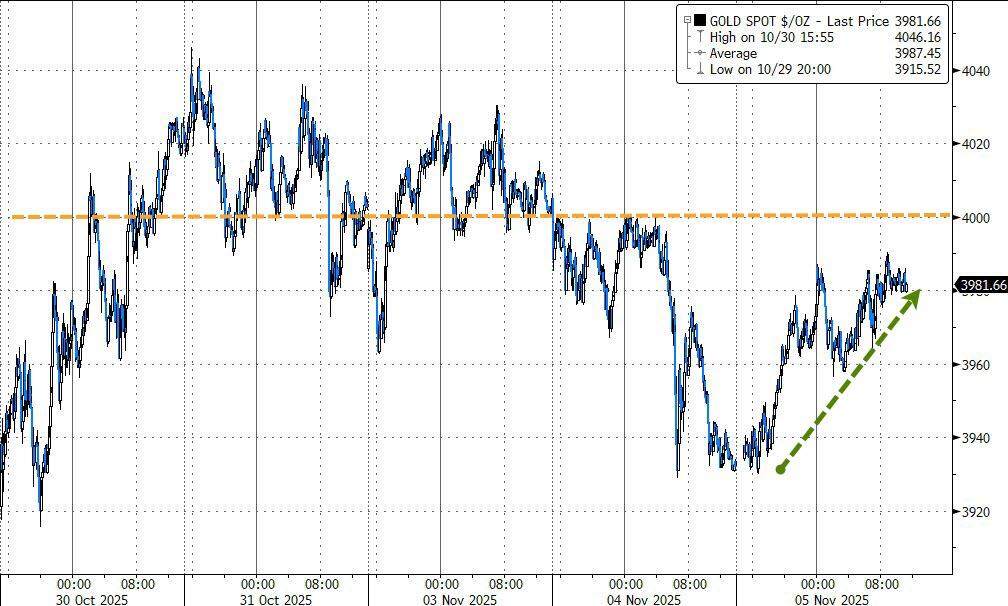
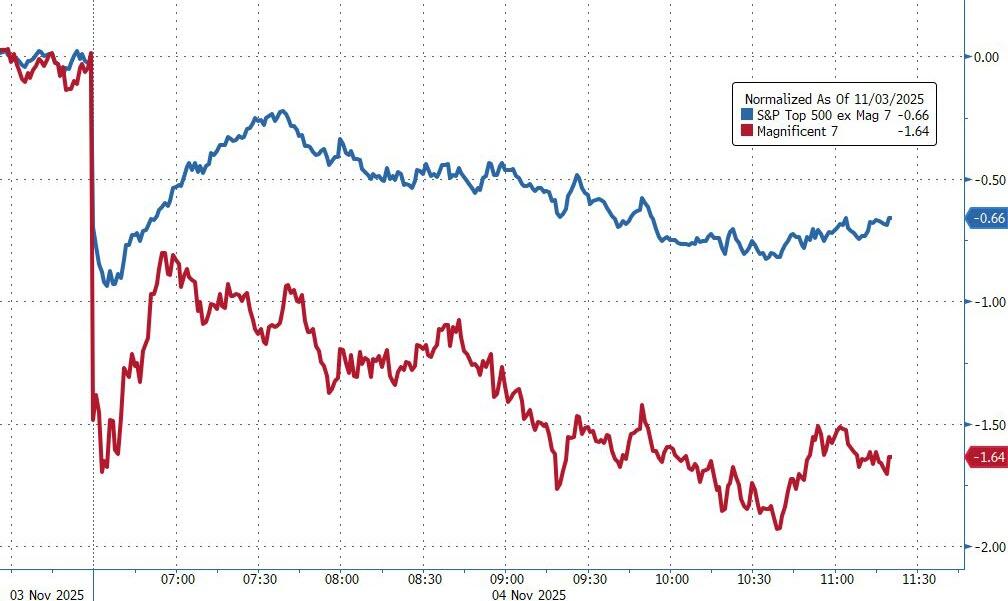
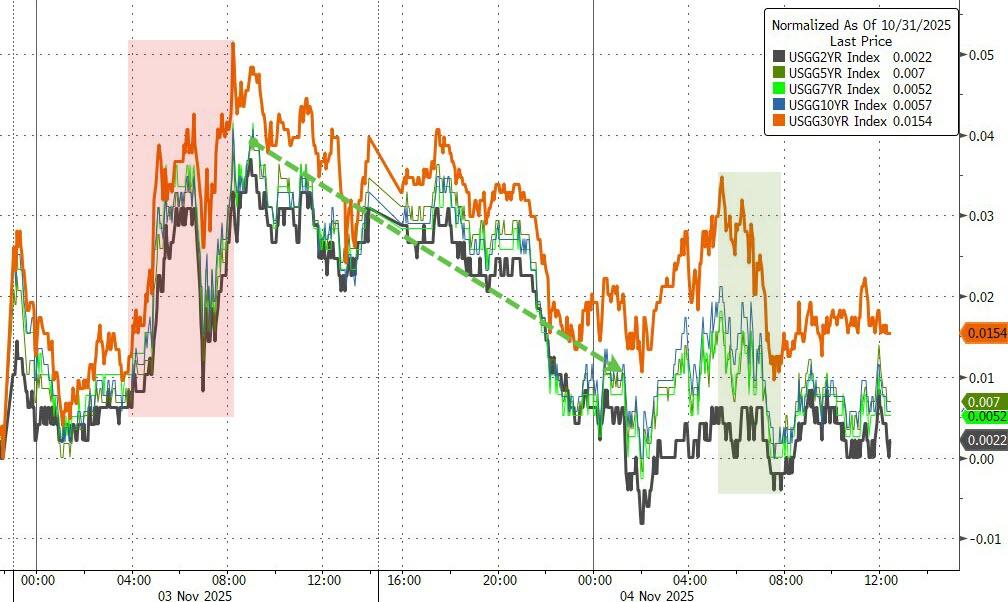
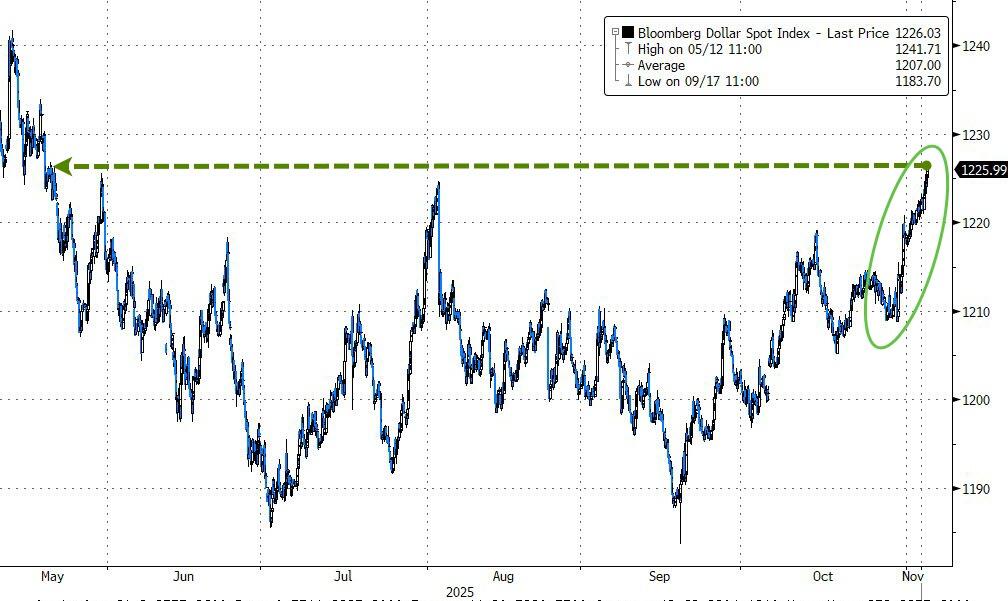
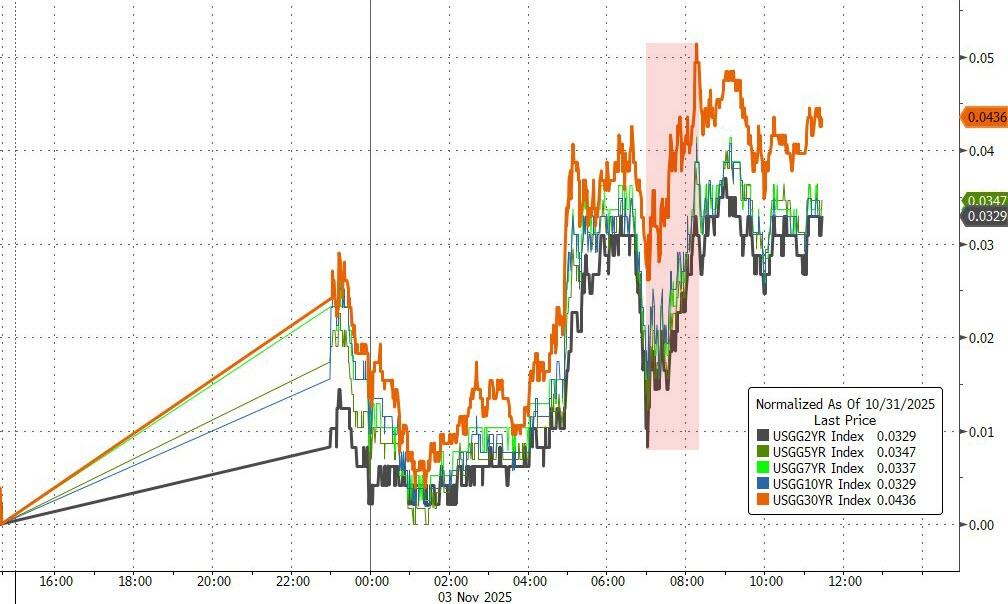
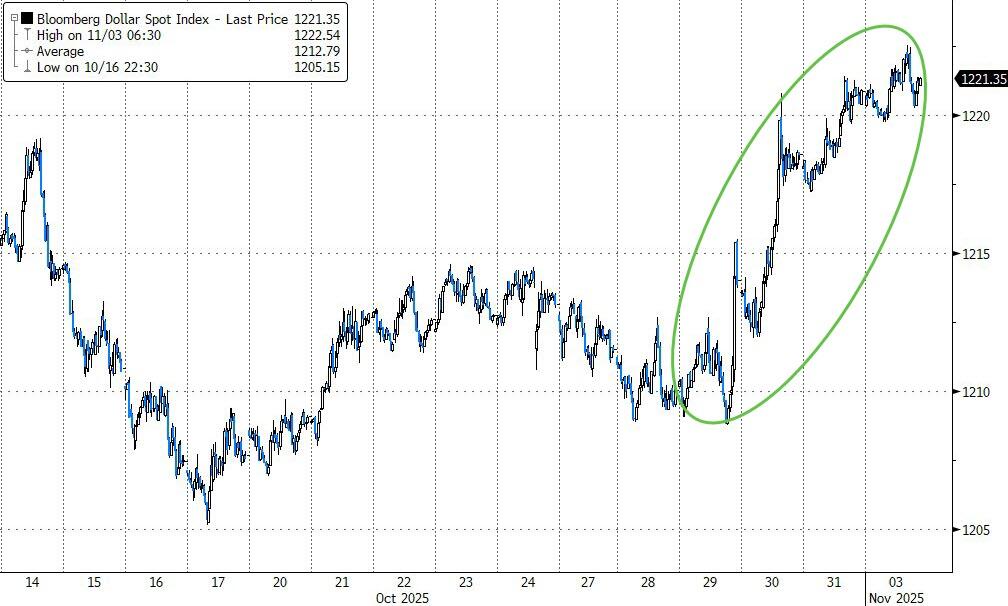
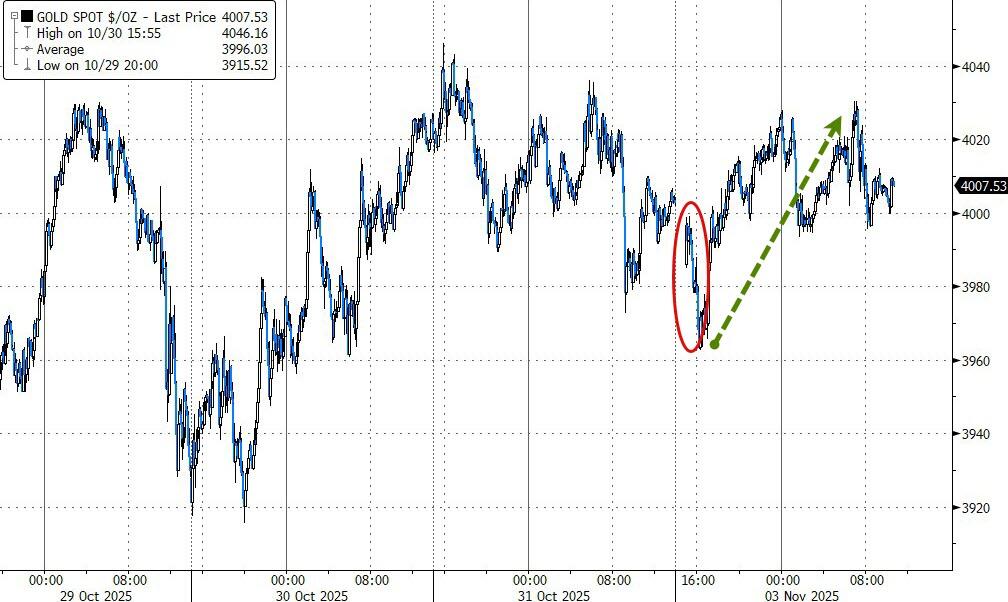
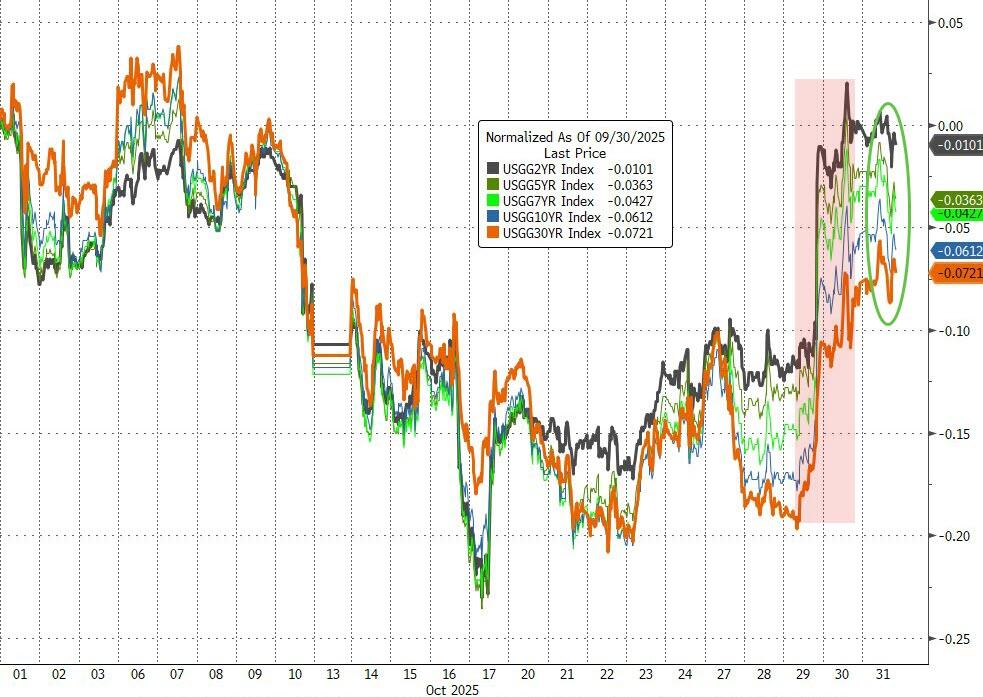
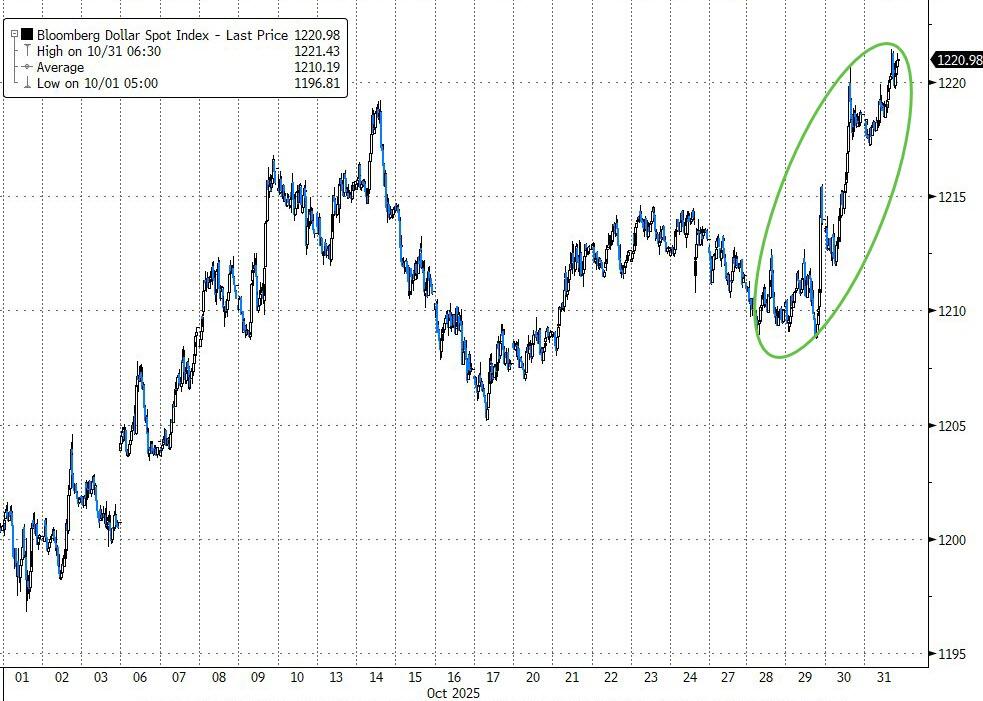
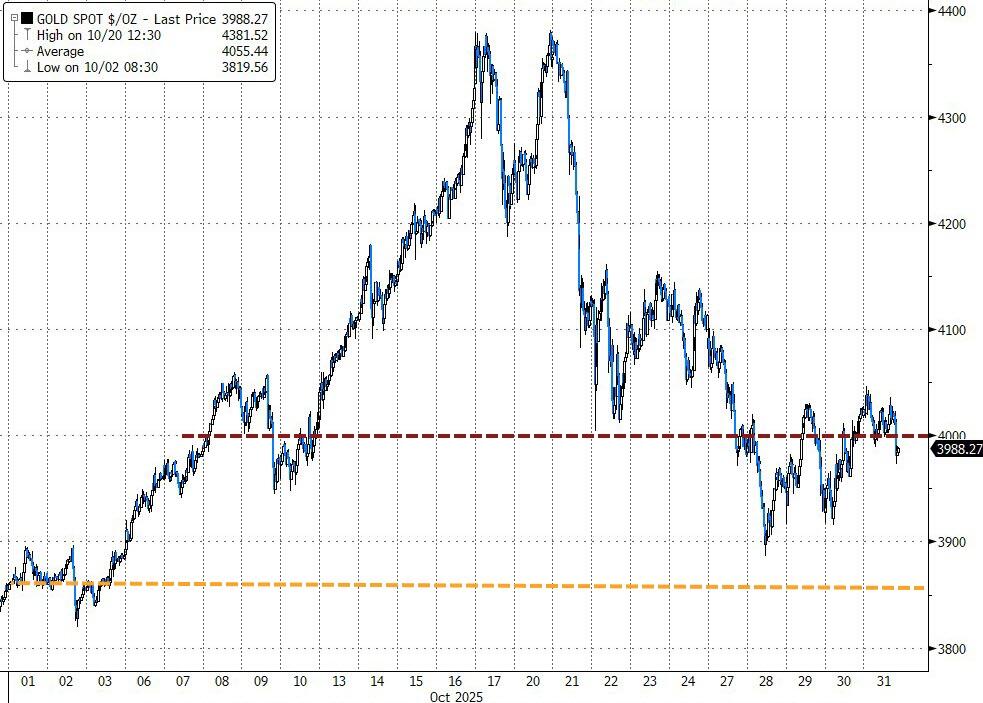
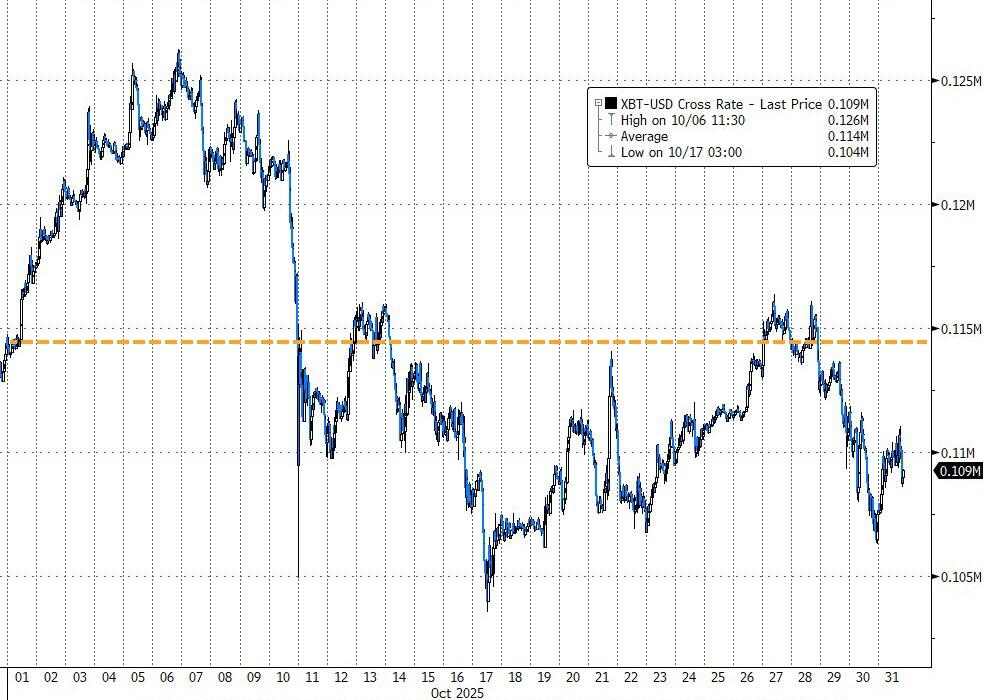
Tech stocks bore the brunt of the selling, with the Mag 7 once again lagging the rest of the S&P 500. Bond yields dipped, the dollar softened, and gold got a brief lift—but couldn’t hold the $4,000 mark. Bitcoin also slid with tech, though it found support around $101,000.
Some analysts think markets could bounce once the government reopens, but the odds of that happening by November 15 have dropped below 50%.
So, here’s the big question: Is this just a temporary shakeout, or are we looking at the start of a broader risk-off shift?
Read More