

- Moving the market
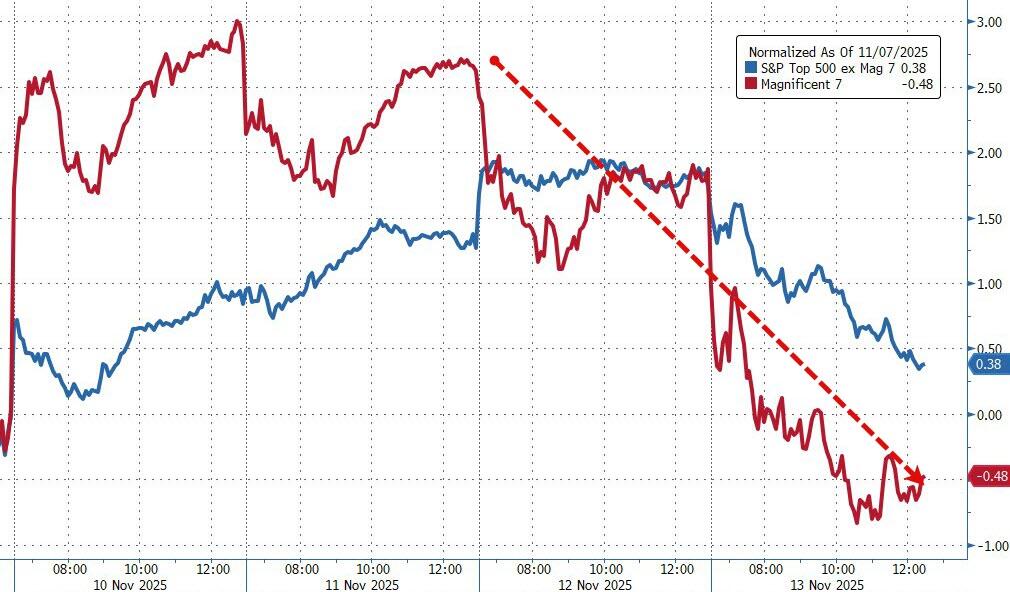
Stocks got hit again, and this time the culprit was clear: people are suddenly side eyeing those sky-high AI valuations.
Nvidia dropped another 2% (now down 10% this month) ahead of its big earnings on Wednesday, and the rest of the Magnificent 7 felt the heat too—Amazon and Microsoft both bled.
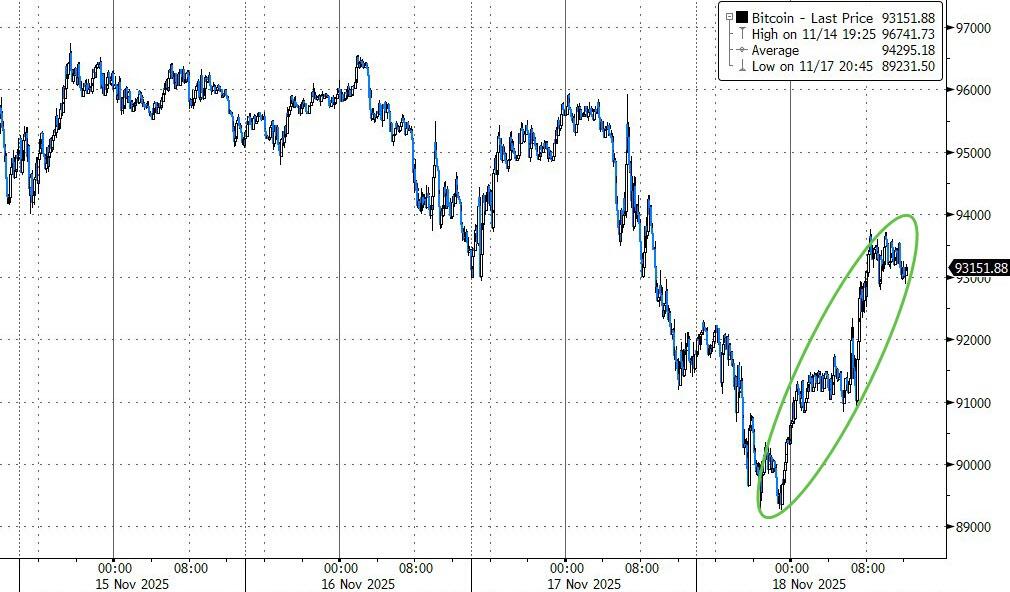
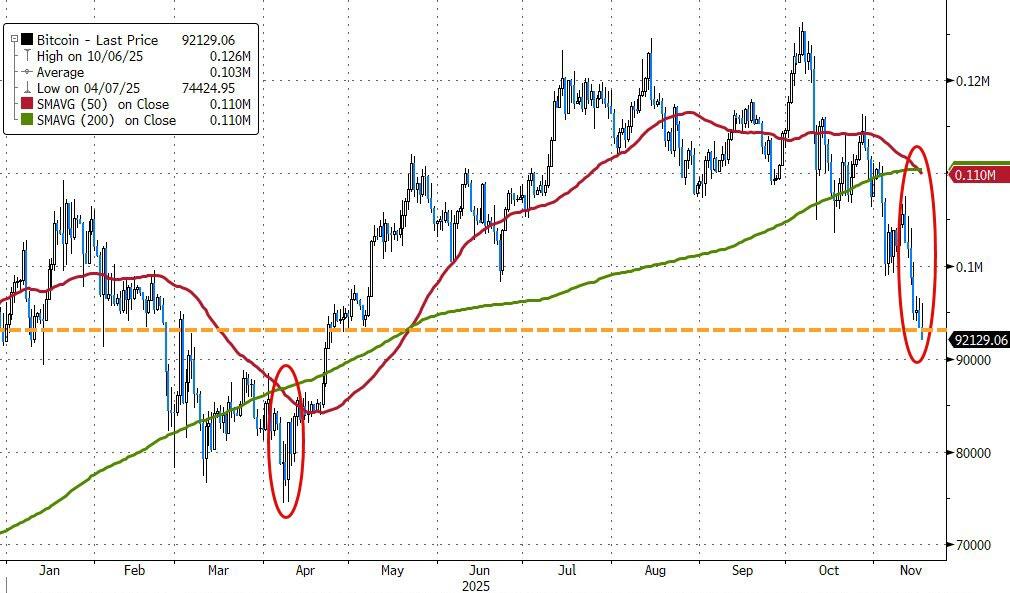
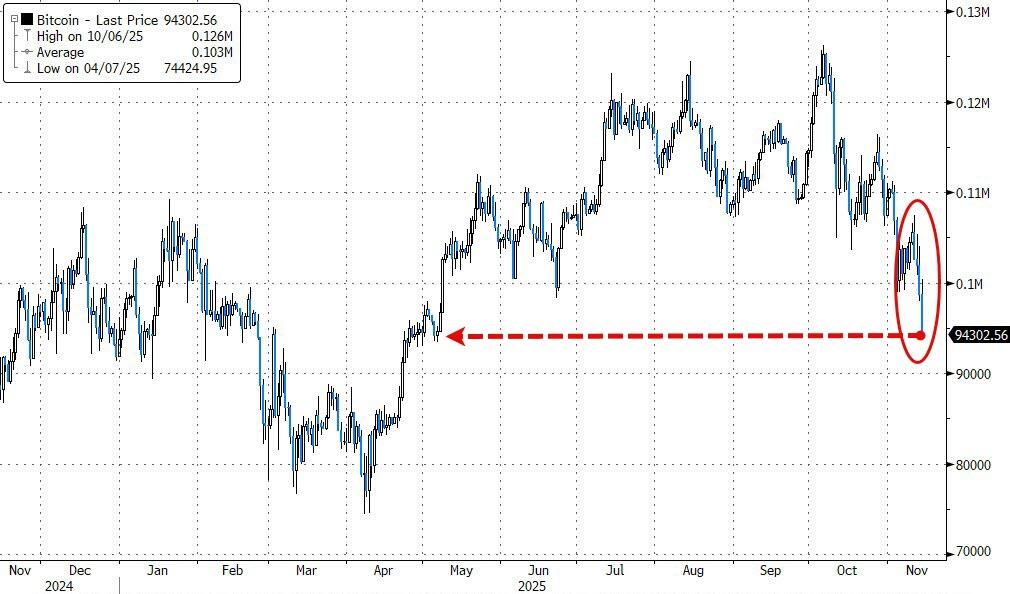
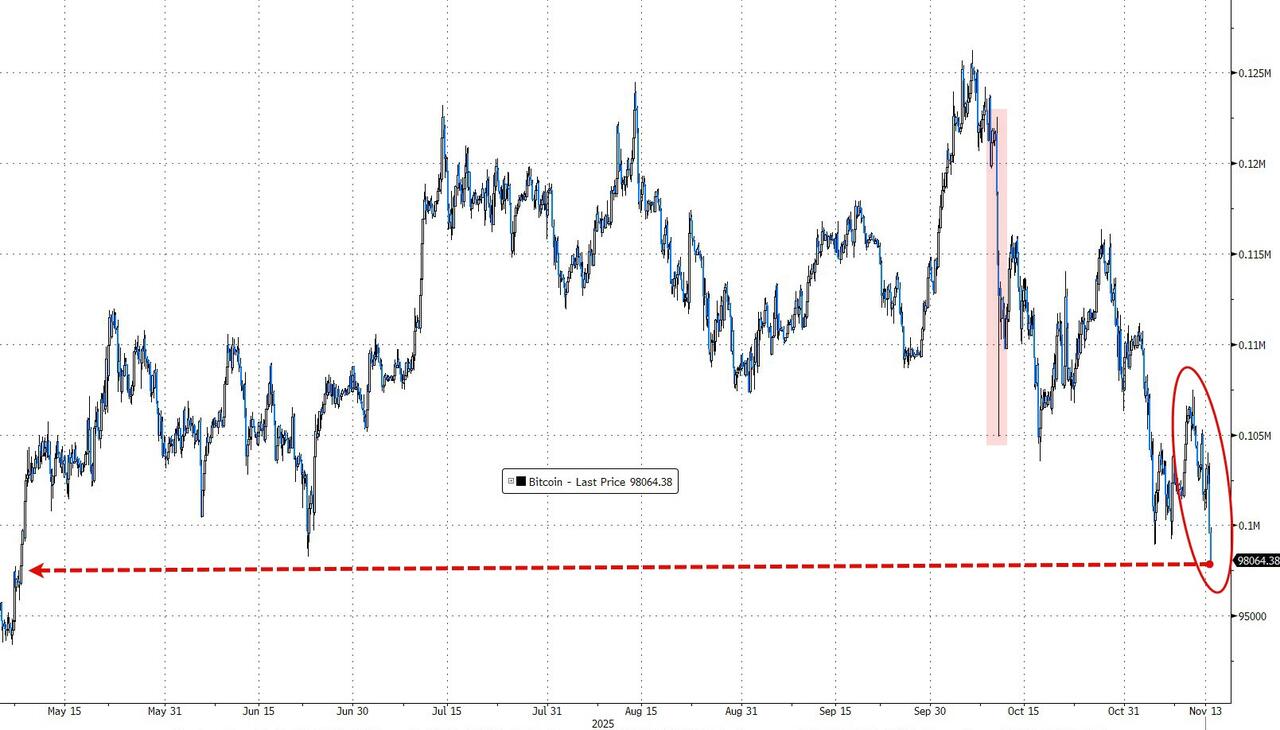
Bitcoin even dipped below $90K for a hot second, which felt like the market flashing a giant “risk-off” sign.
Outside of tech, Home Depot whiffed on earnings and slashed guidance, so that didn’t help the mood.
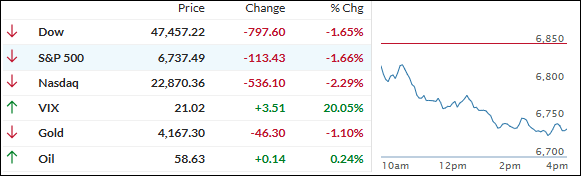
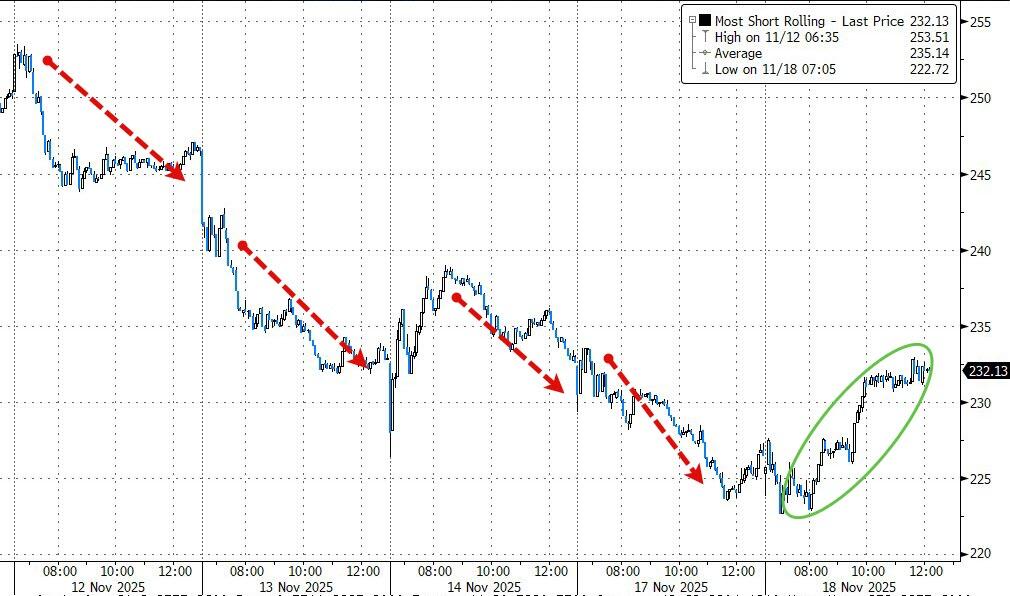
The three major indexes all closed red, with the S&P 500 now on a four-day losing streak. Small caps held up better than the Nasdaq (short squeeze magic), but everything still finished below their 50-day moving averages.
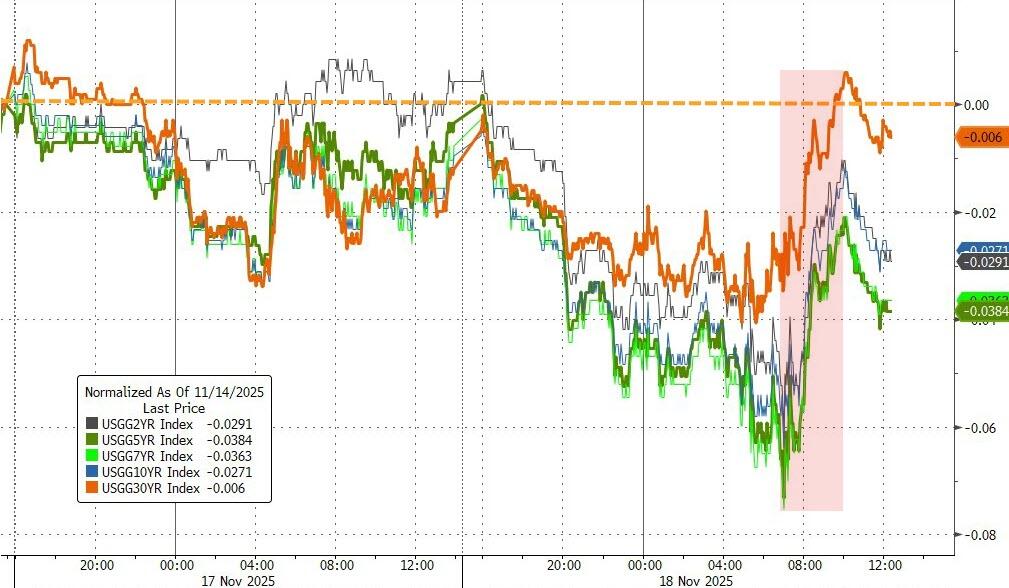
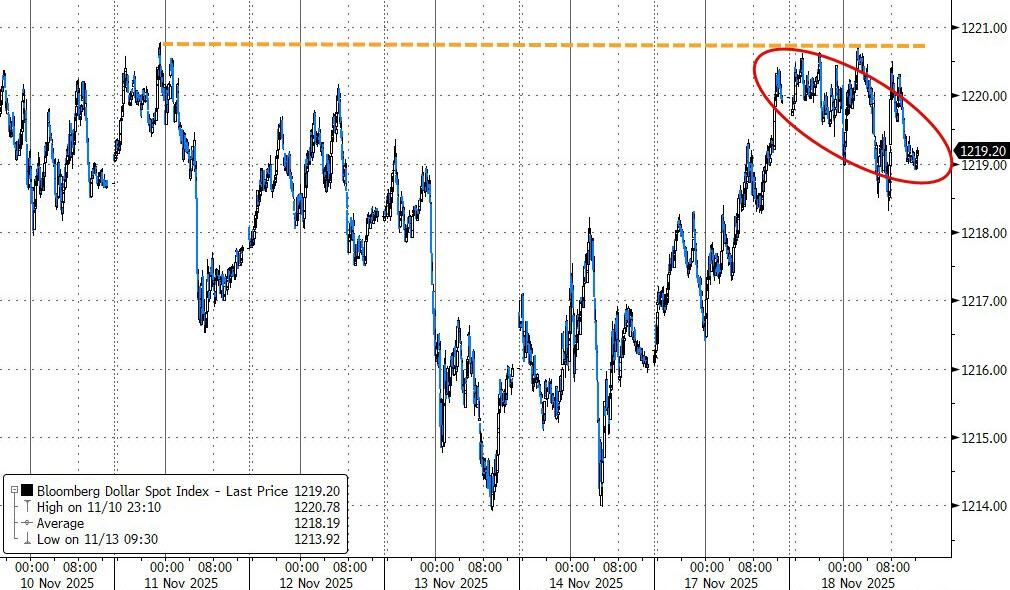
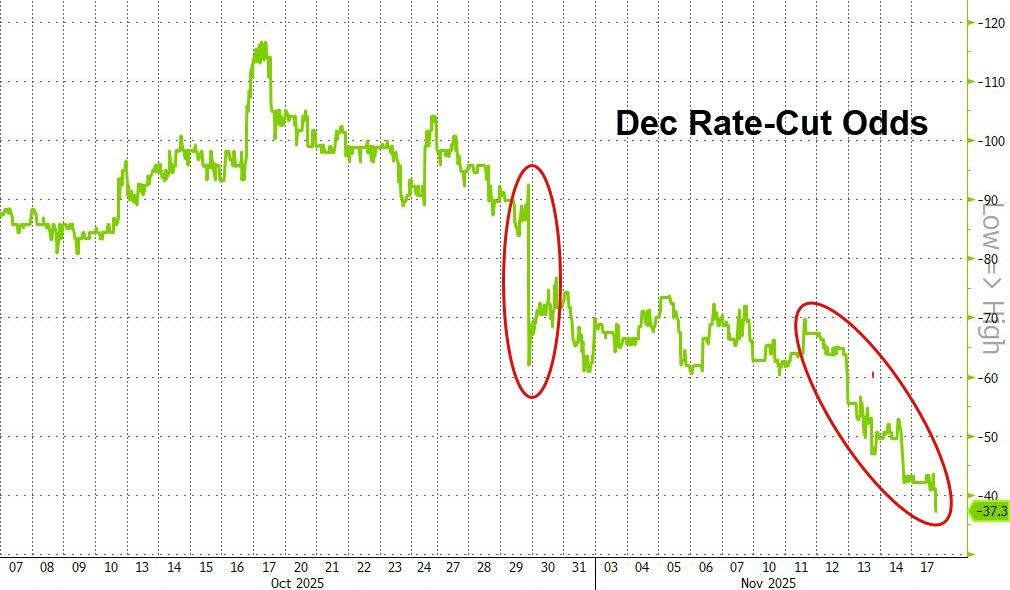
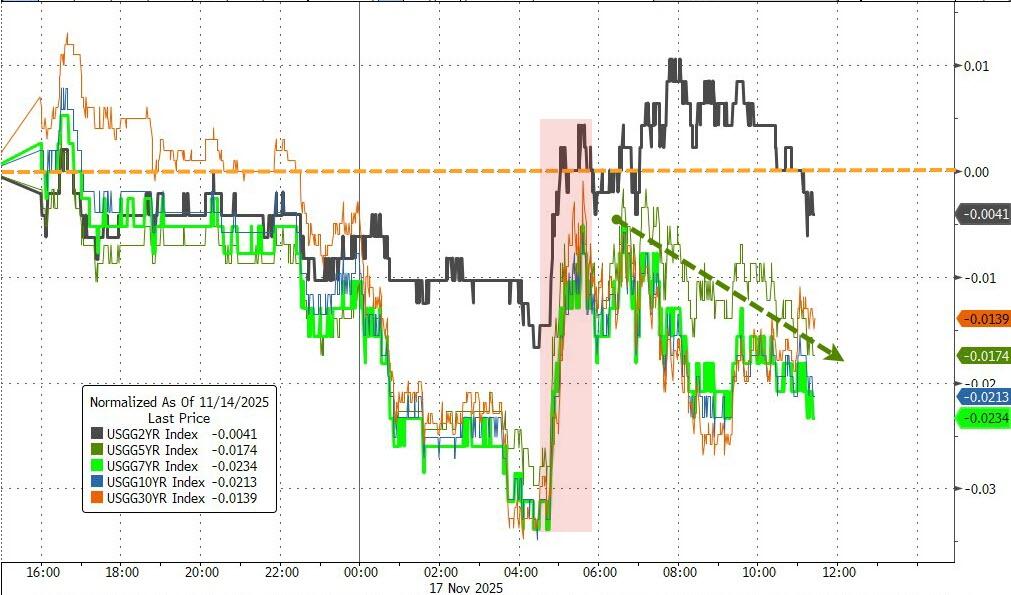
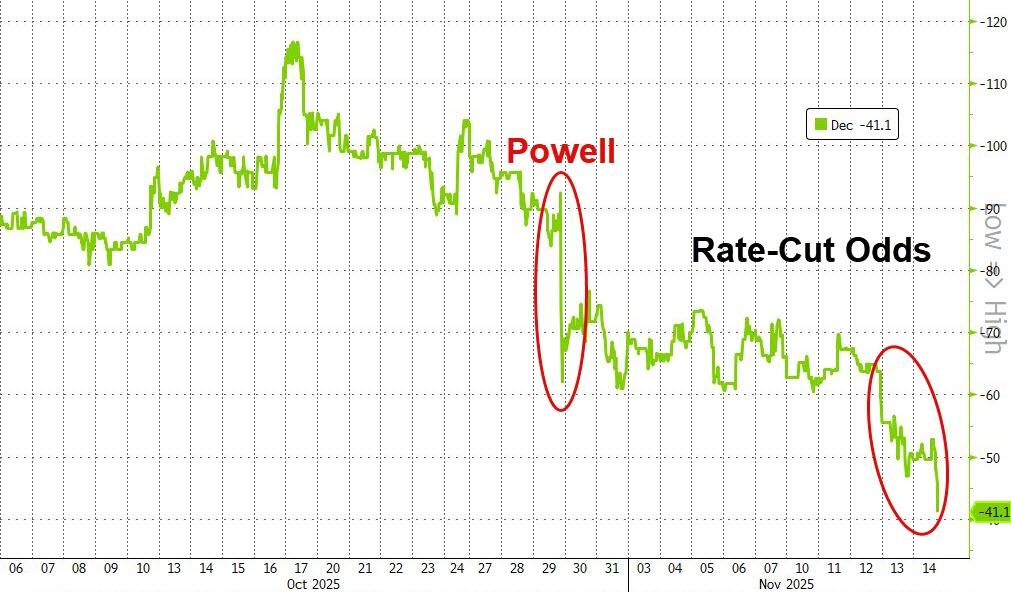
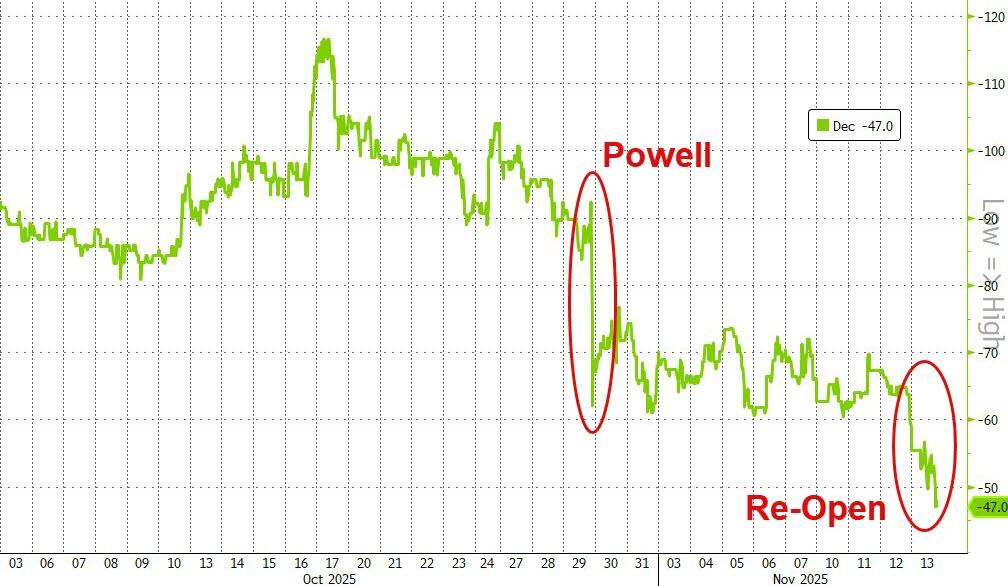
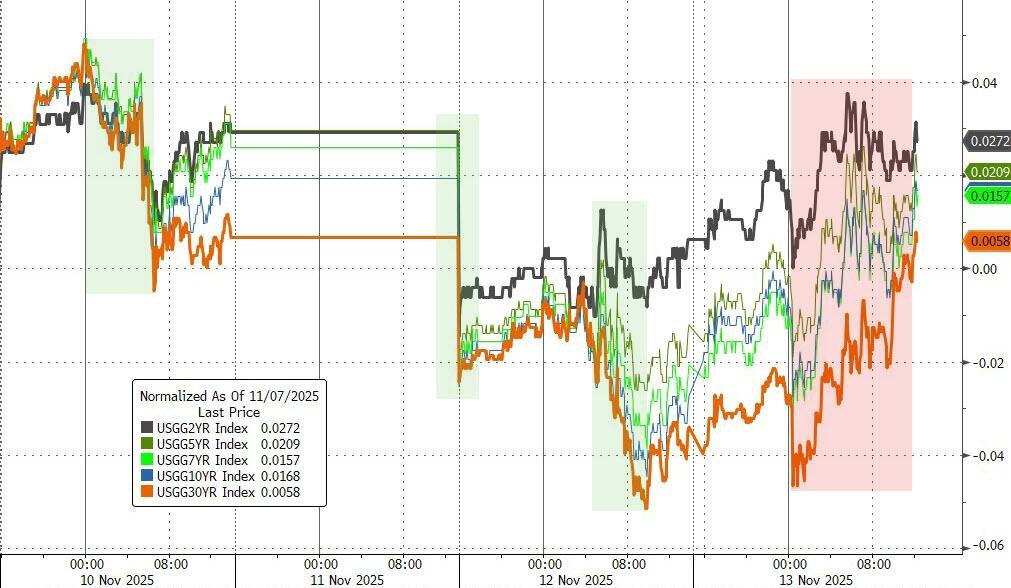
The December rate-cut odds have plunged from 90%+ a month ago to roughly 50-50 today, so the “Fed put” feels a little shaky. Bond yields were all over the place, and the dollar just kind of floated.
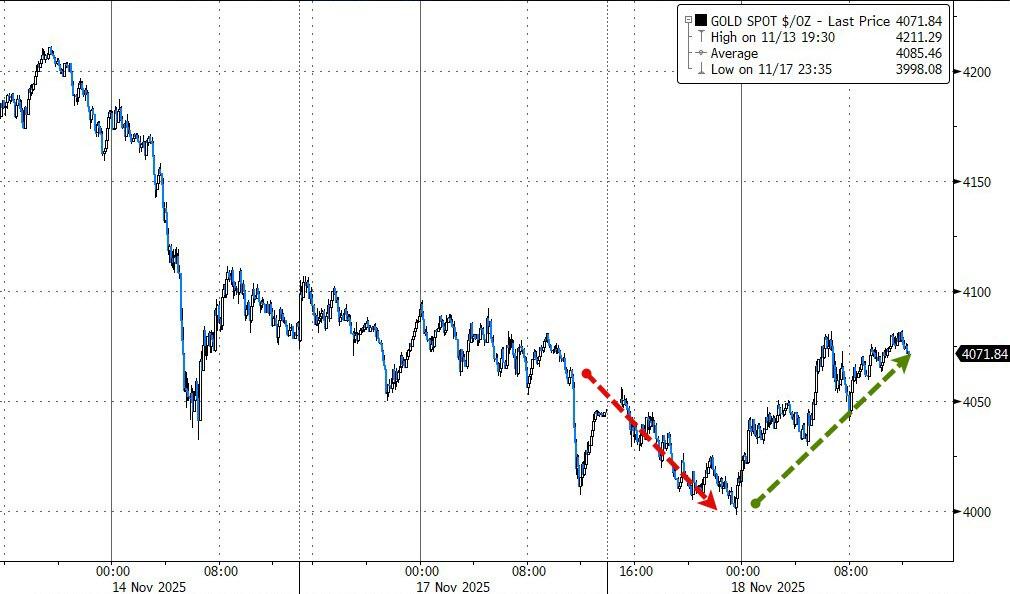
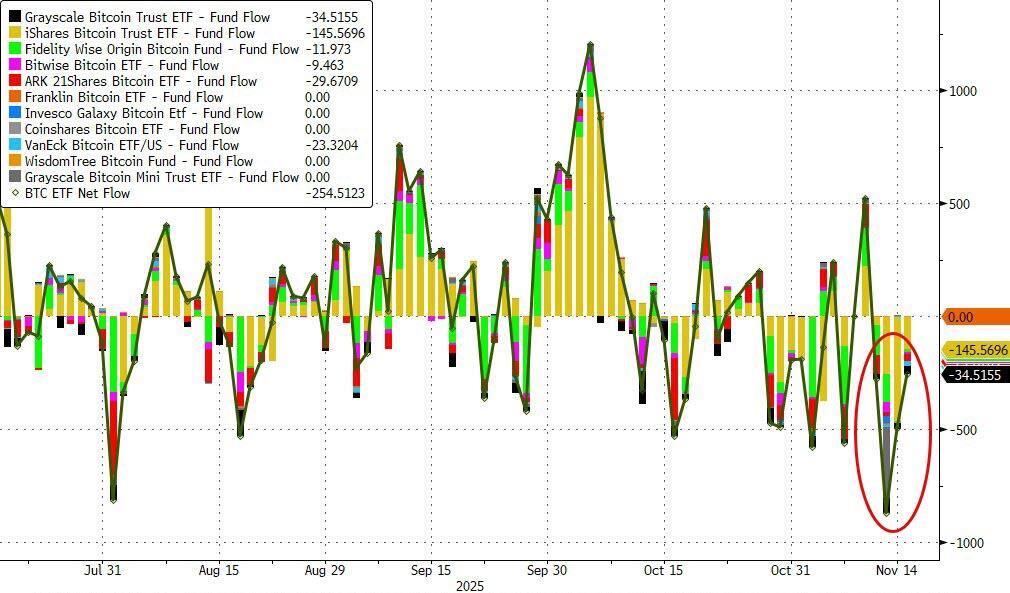
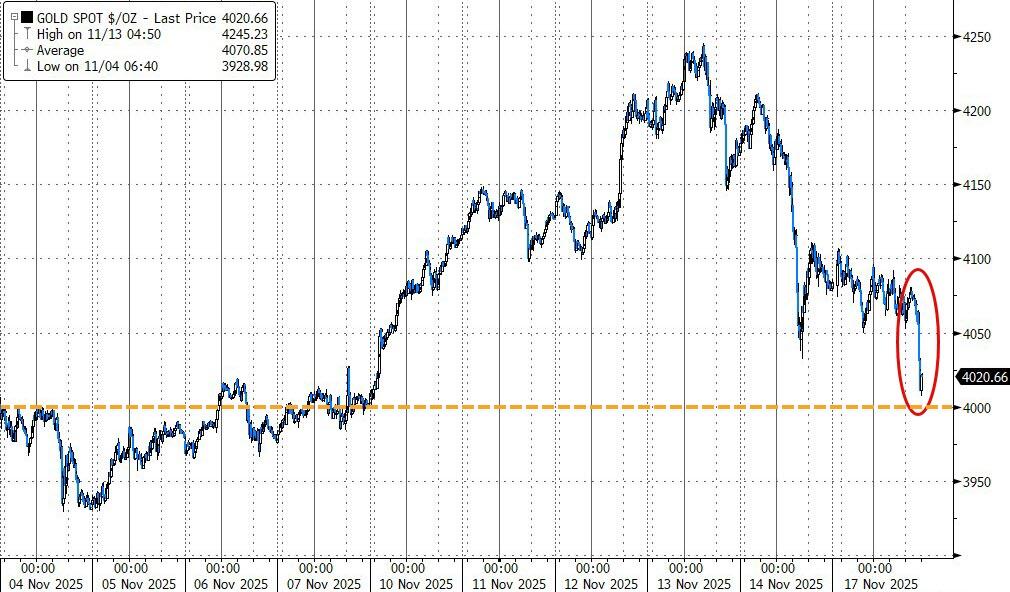
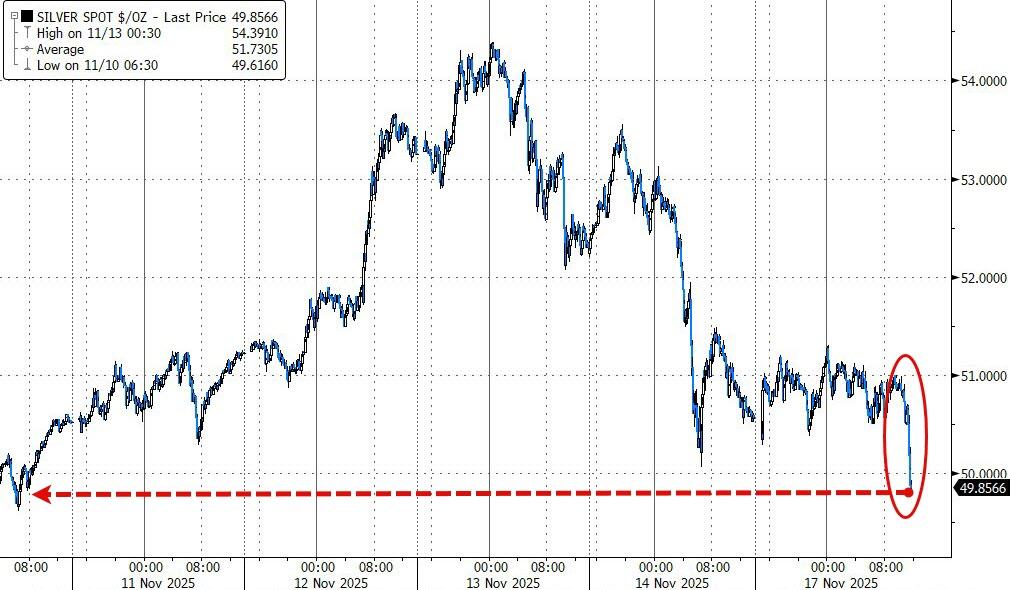
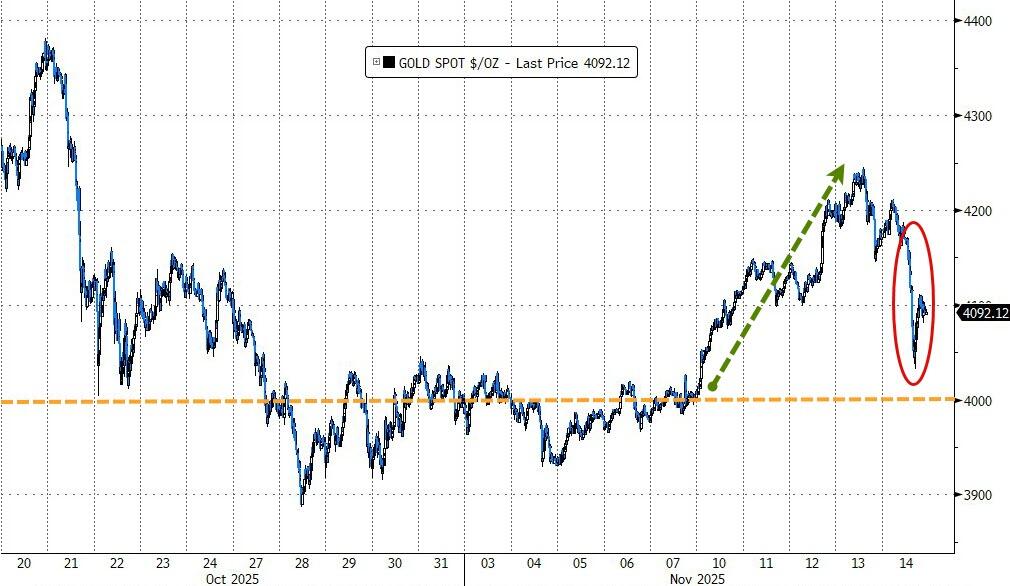
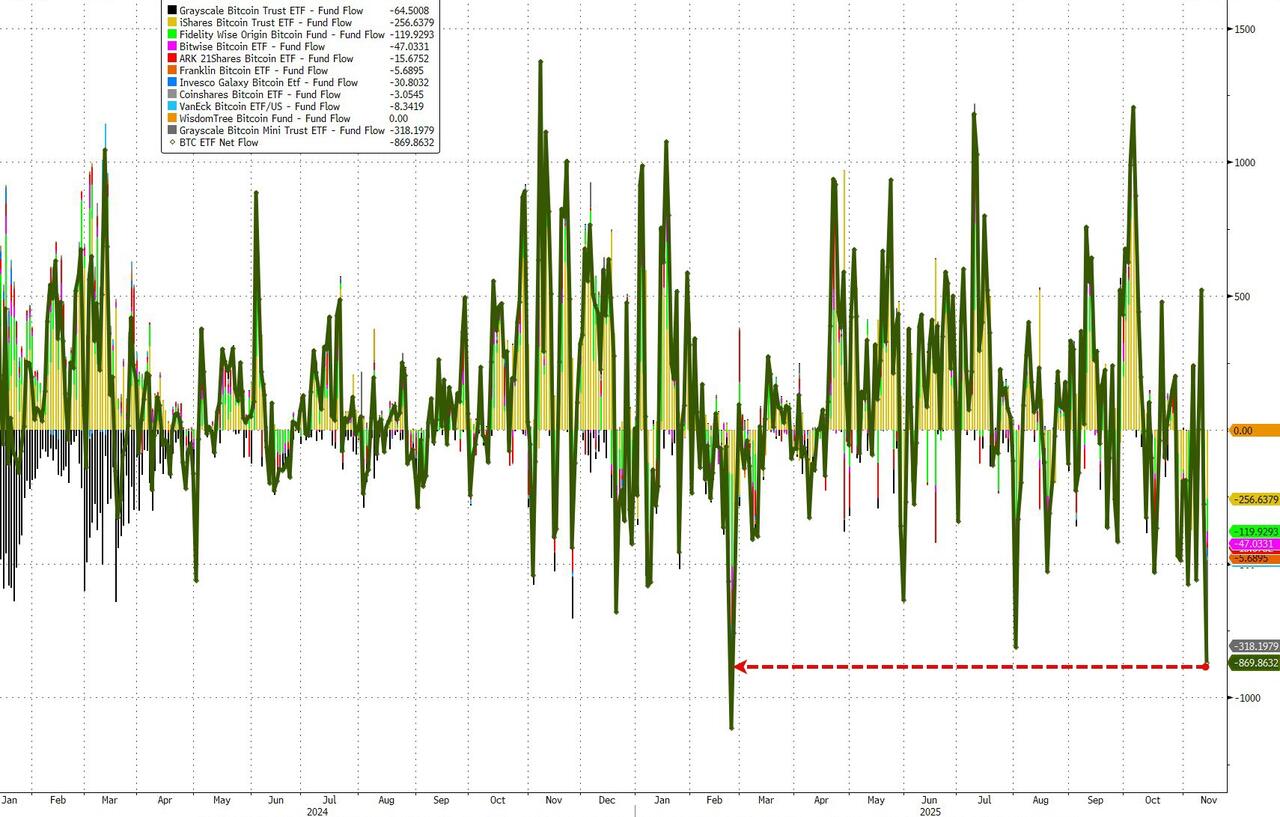
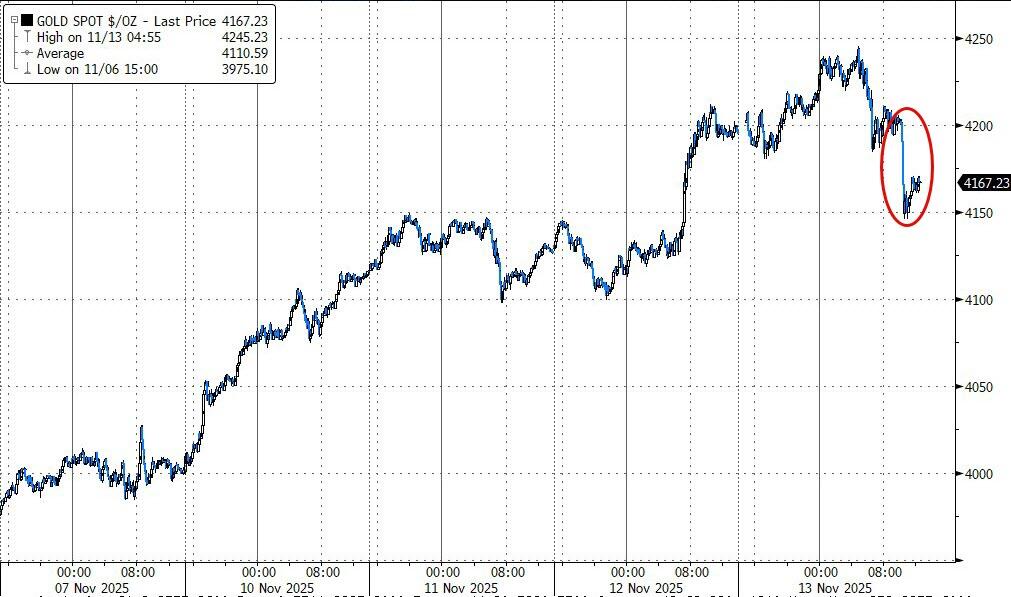
On the bright side, our portfolios still squeaked out a green day thanks to the shiny stuff: Gold bounced hard off the $4,000 level, silver jumped 1.4%, and bitcoin roared back after that brief dip (ETF outflows slowed, so the panic selling eased).
Bottom line? We’re stuck in this weird loop until we get some data that’s decent on growth but tame on inflation—basically the Goldilocks combo that calms stagflation worries and keeps the Fed cutting. Until then, it’s chop, chop, chop.
Read More


