
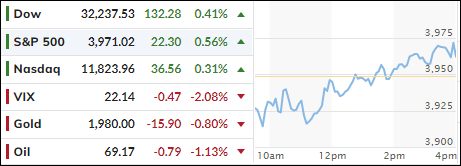
- Moving the markets
Again, the belief prevailed on Wall Street that the worst of the regional banking crisis is now in the rearview mirror, which caused traders and algos to push the major indexes higher for the second day in a row.
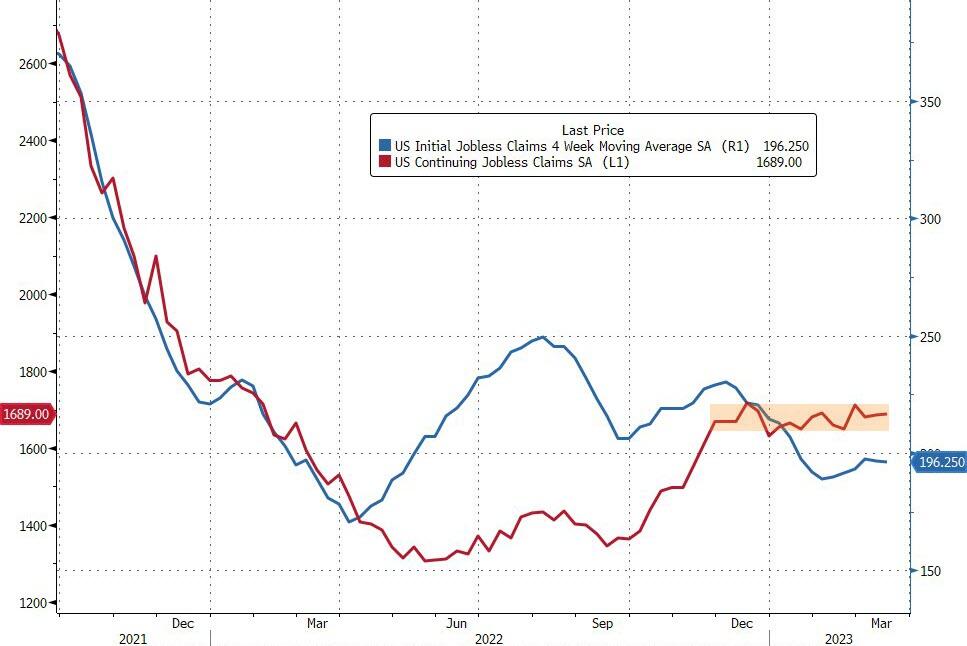
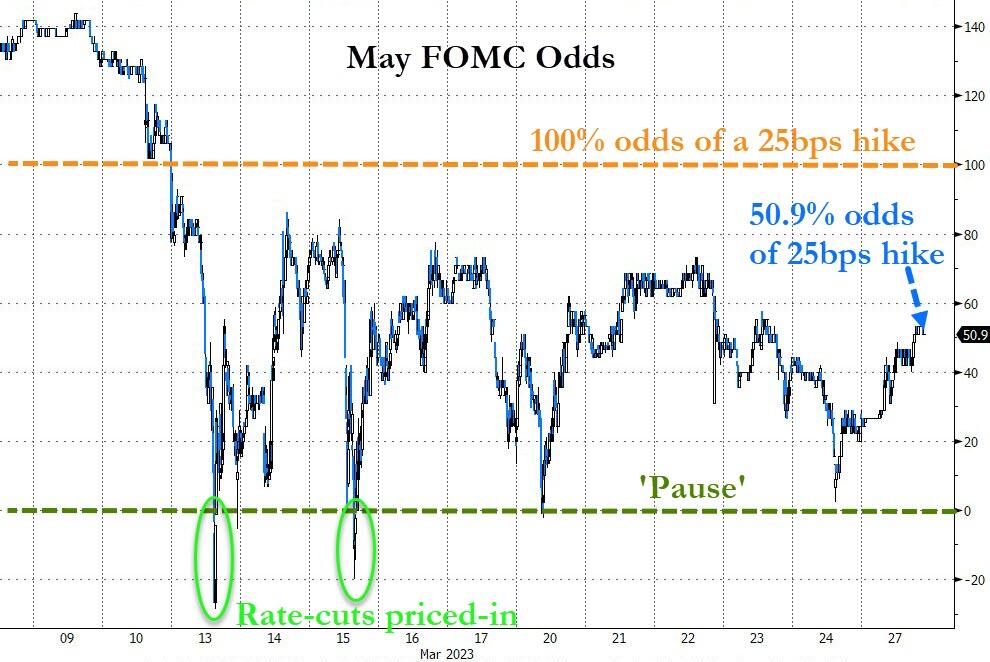
Jobless claims dropped moderately but have not gone anywhere in four months, thereby supporting hopes that the Fed might be inclined to slow down its tightening efforts, as the labor market appears to show signs of cooling, which in turn gave an assist to equities.
To me it looks like the market is getting ahead of itself by pricing in a Goldilocks scenario, in which we would see the best of both worlds: Traders expecting a recession with low rates and reduced inflation in an environment that does not negatively affect corporate earnings.
Sure, such a setting would indeed be good for equities, but I don’t think this scenario is even remotely realistic, because all banks are in similar situations like the failed ones, it just has not become public knowledge yet.
That means more systemically important institutions will have to be bailed out with money that the US Treasury doesn’t have. Therefore, dollars must be created out of thin air, and inflation will rear its ugly head again. If the Fed is serious about battling back, interest rates/bond yields will have to go considerably higher.
These are all known cause-and-effect facts, the only unknown at this moment is the timing of it.
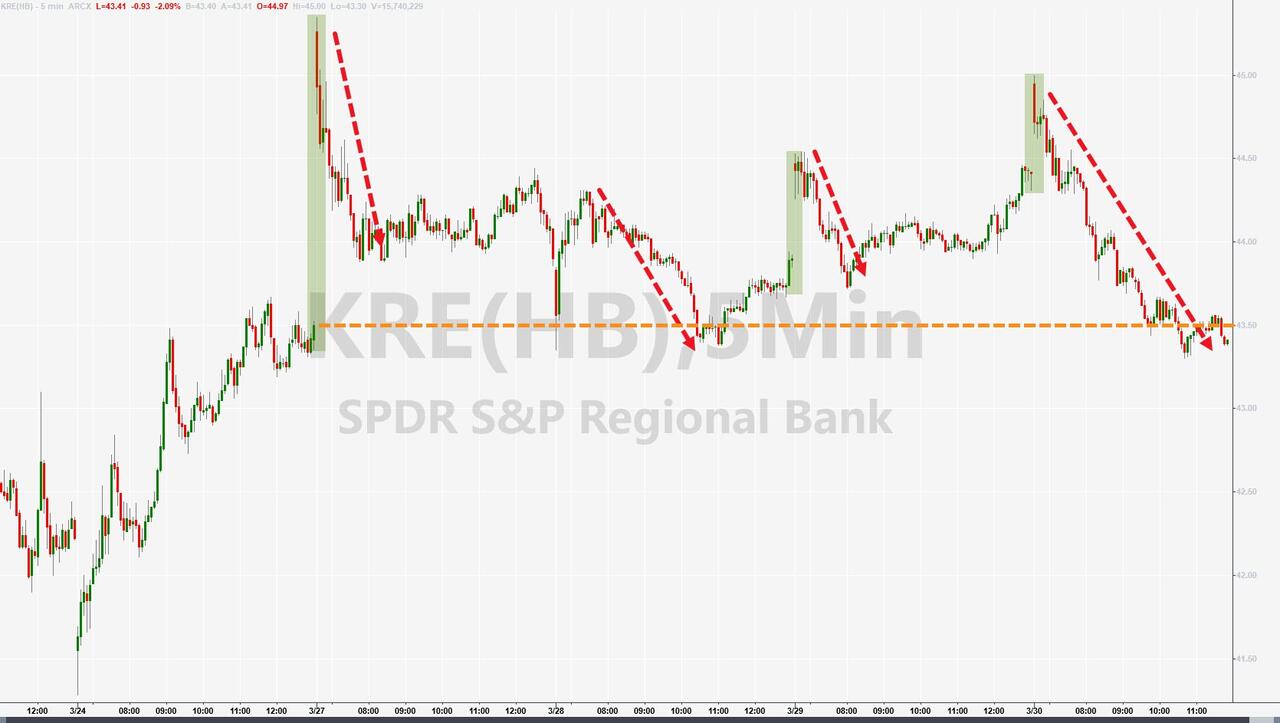
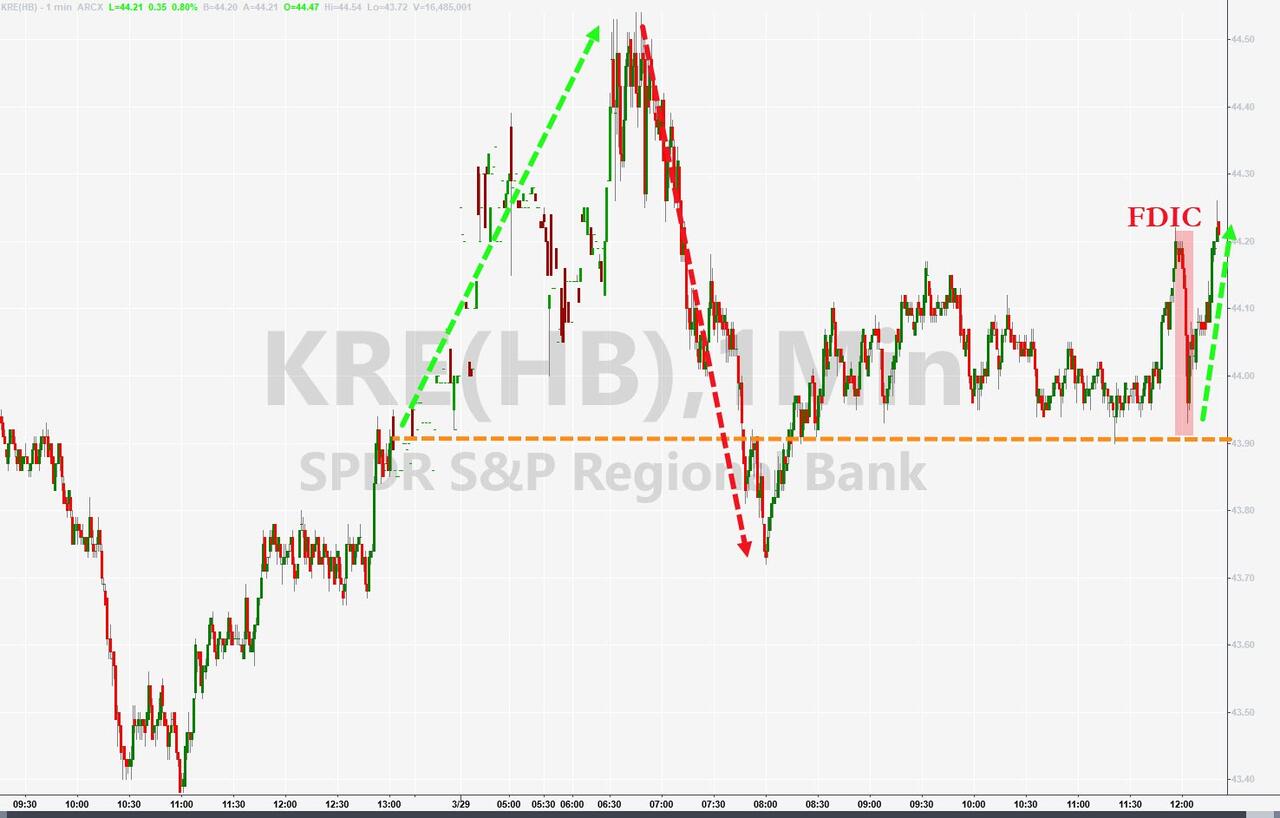
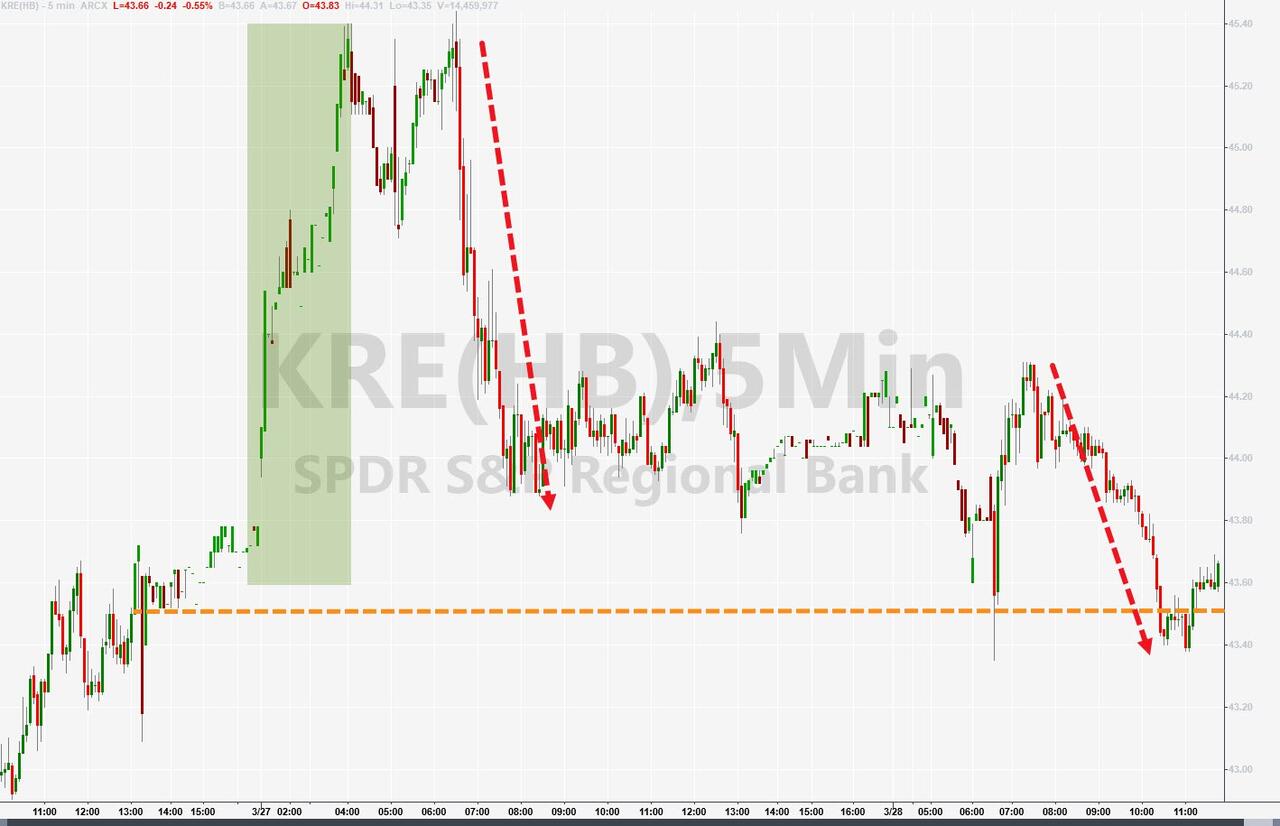
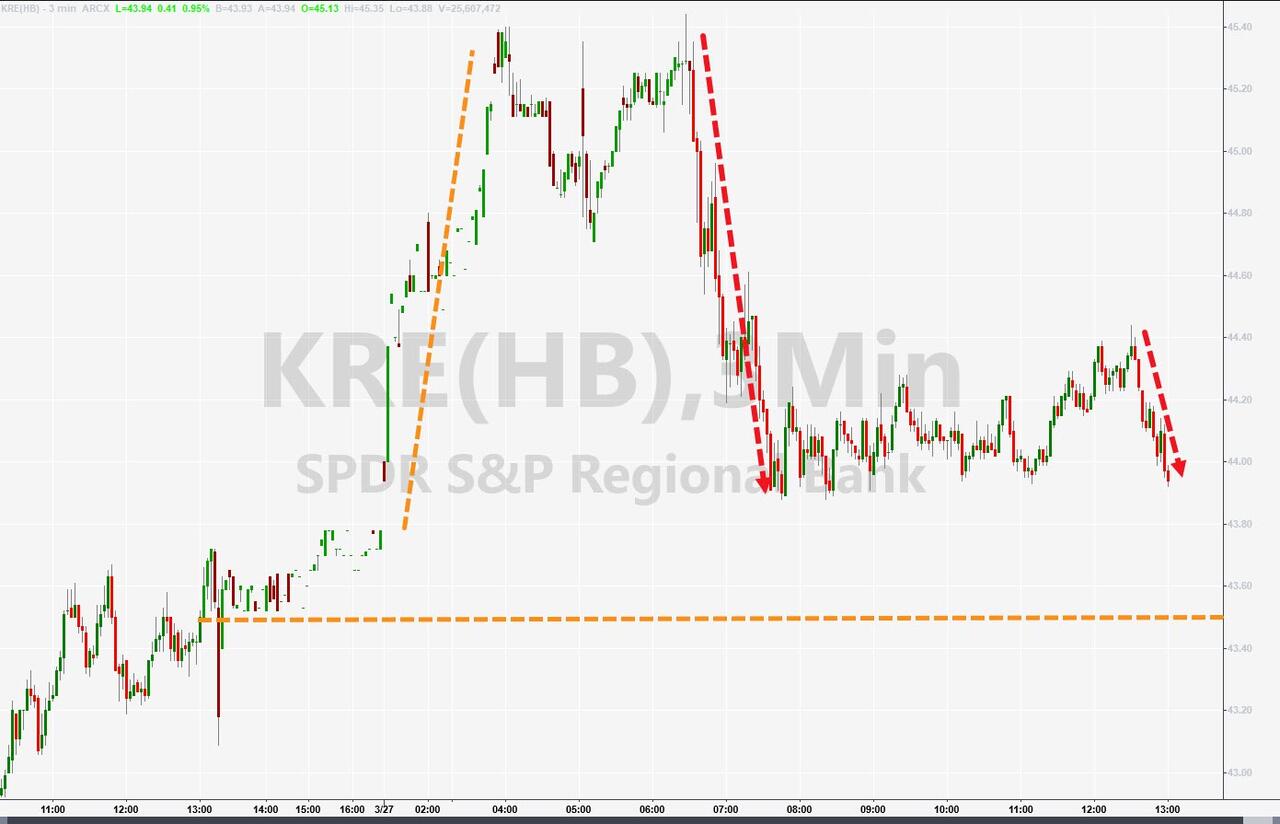
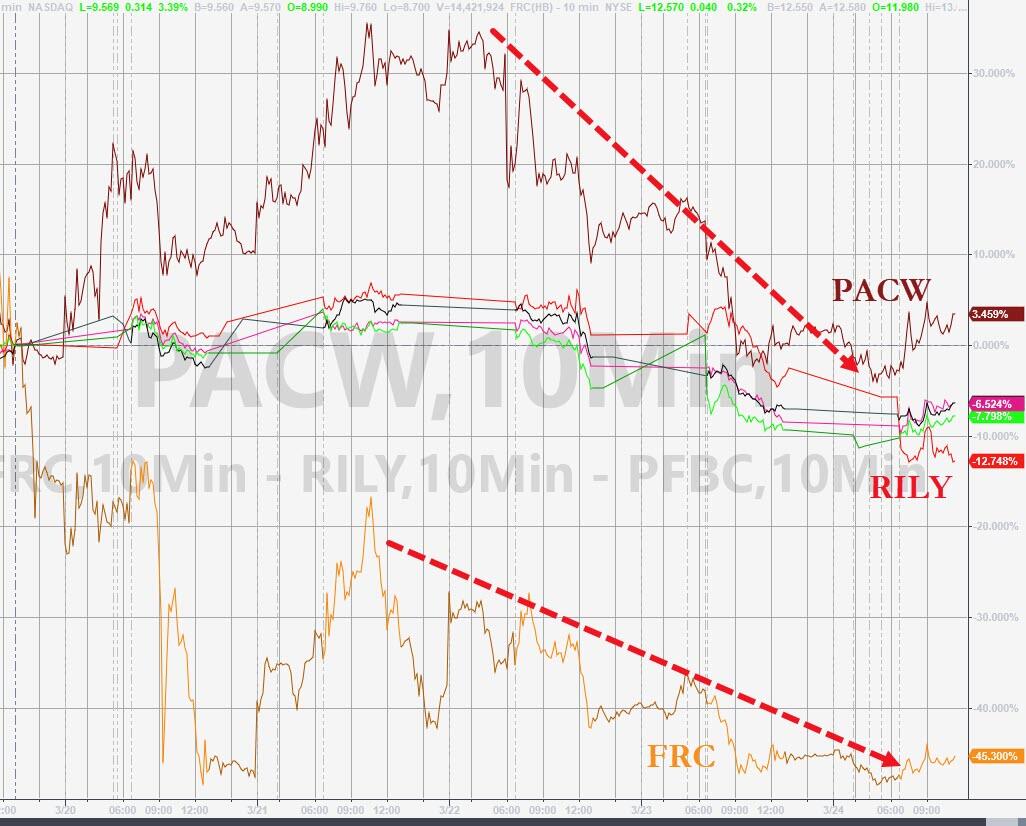
Despite this unbridled optimism about the banking crisis, the regional banking index KRE slipped after riding the roller coaster all day. Stocks followed suit with one Fed governor spewing hawkish words while another walked back the tough talk with some dovish tones, which pulled equities out of their midday slide.
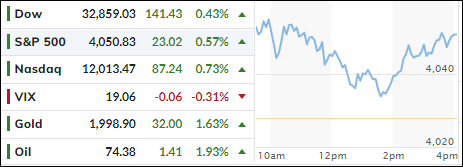
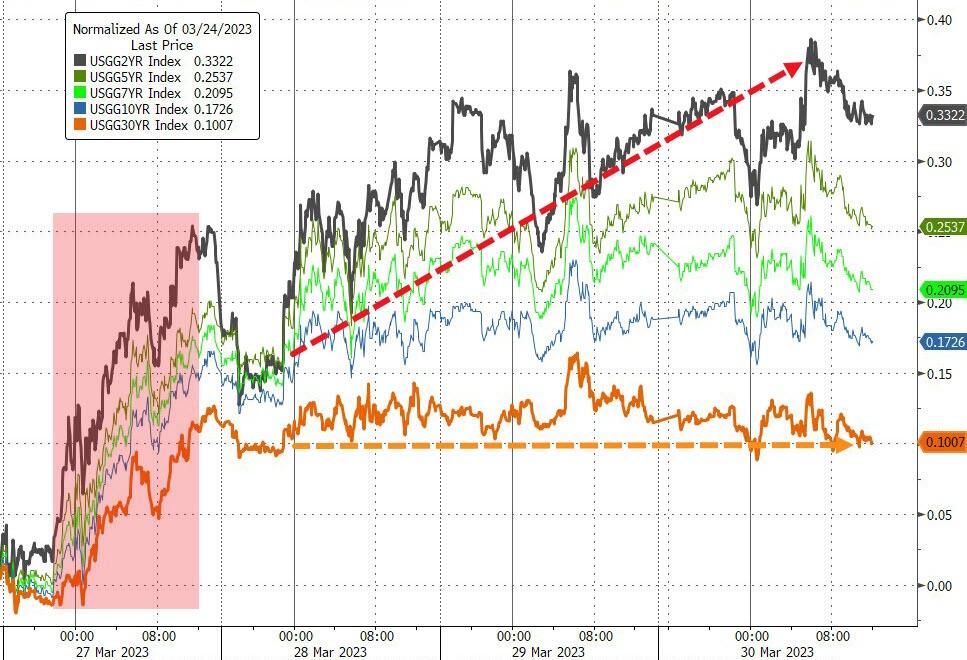
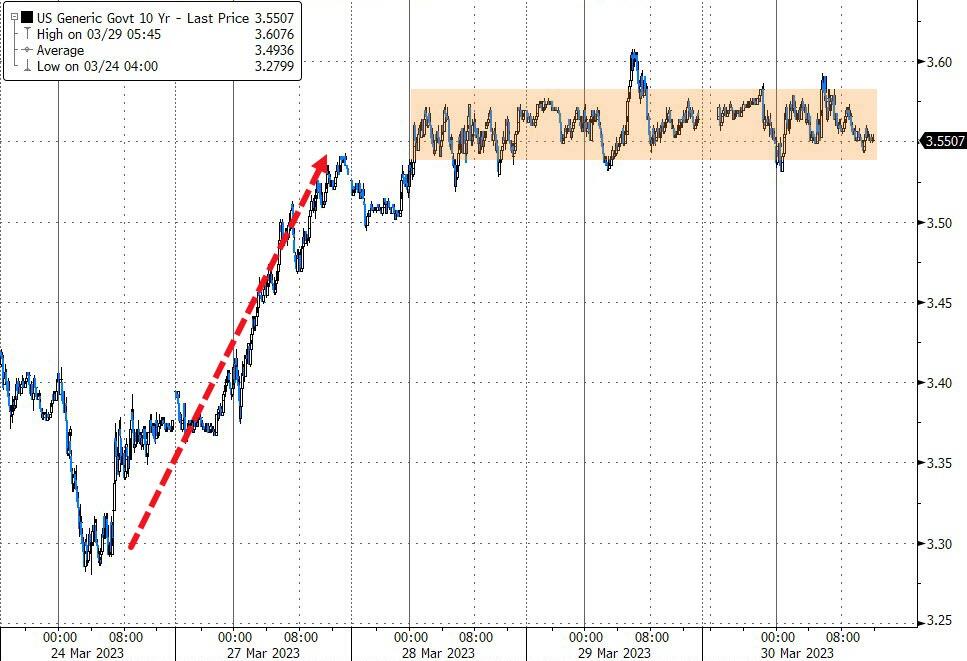
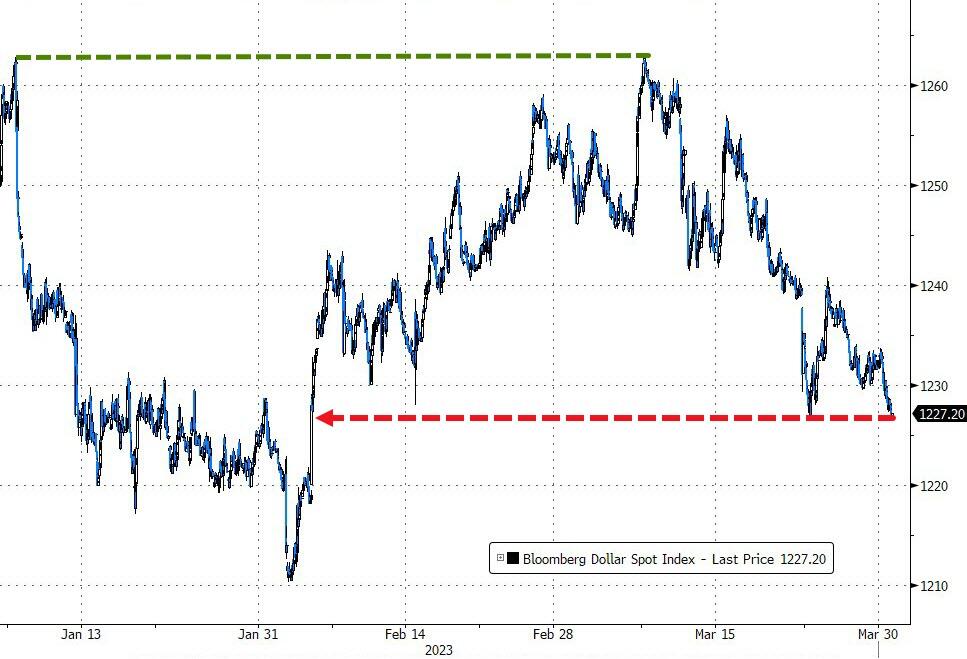
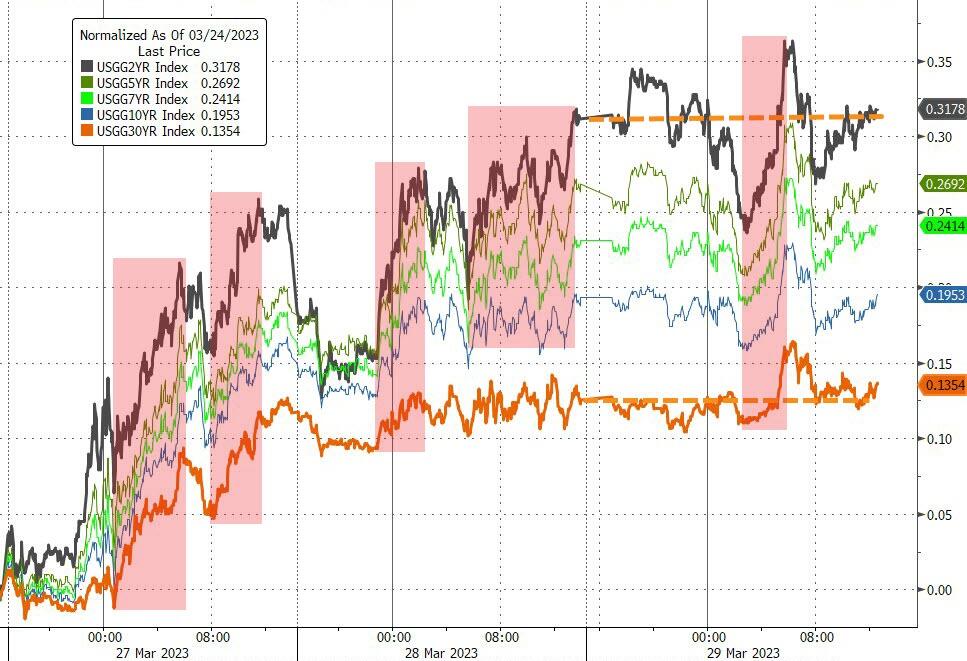
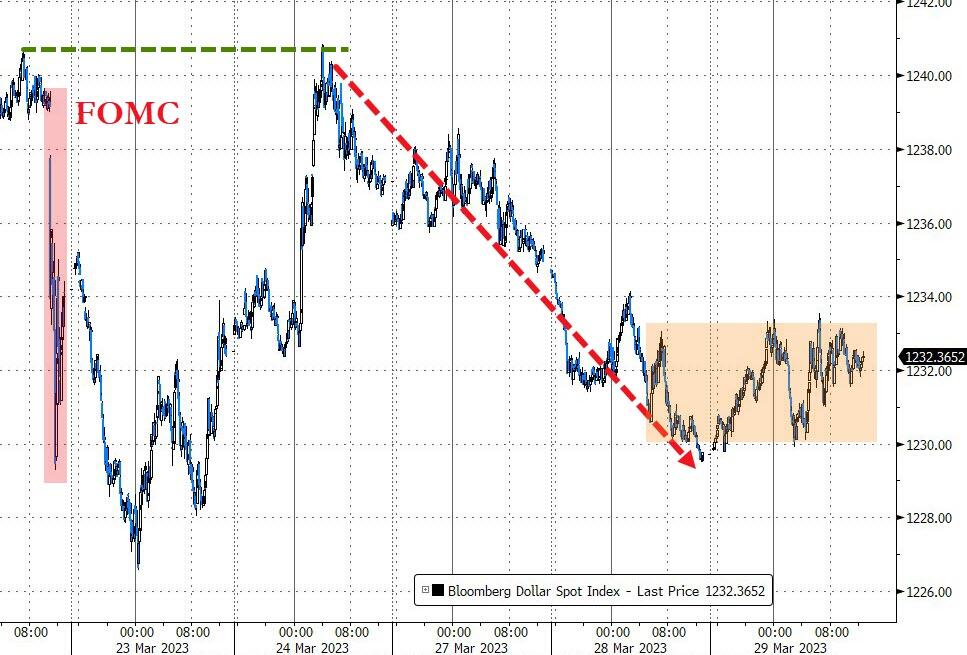
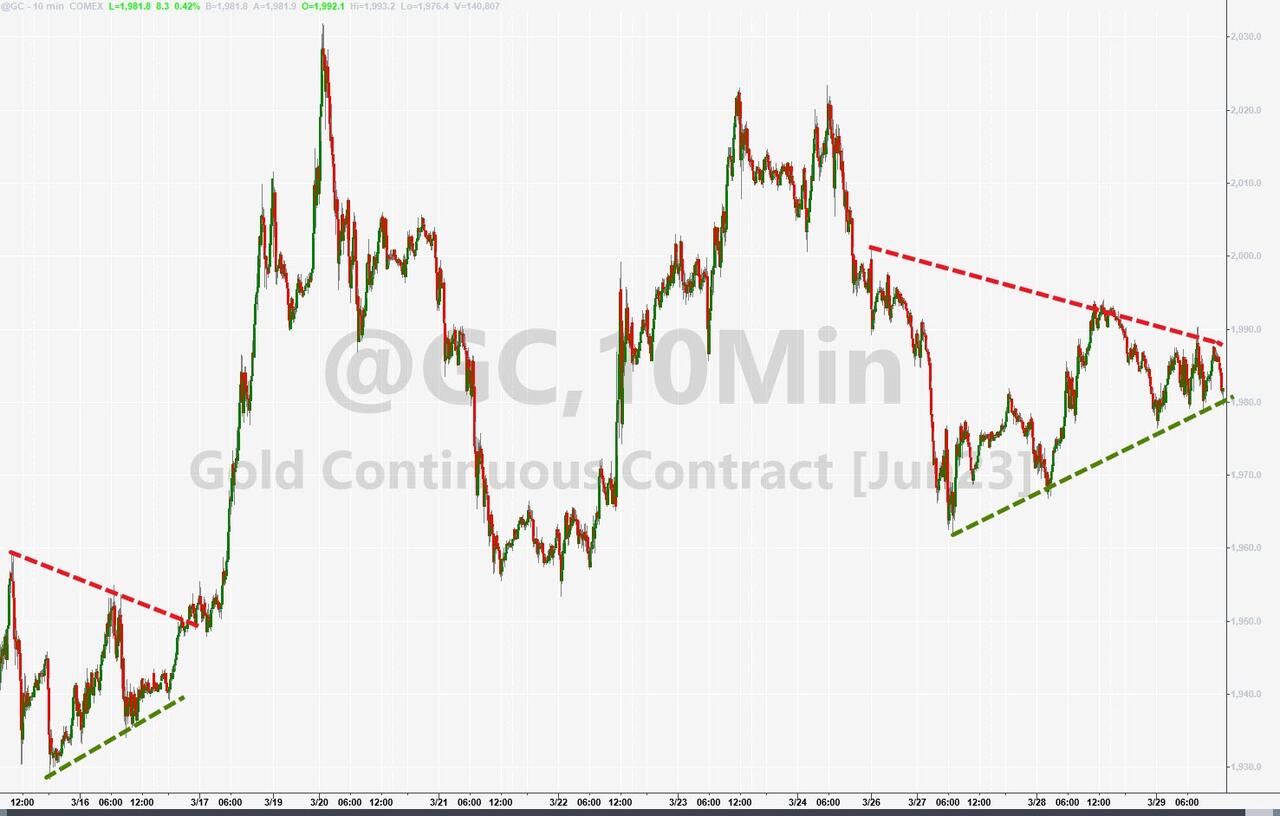
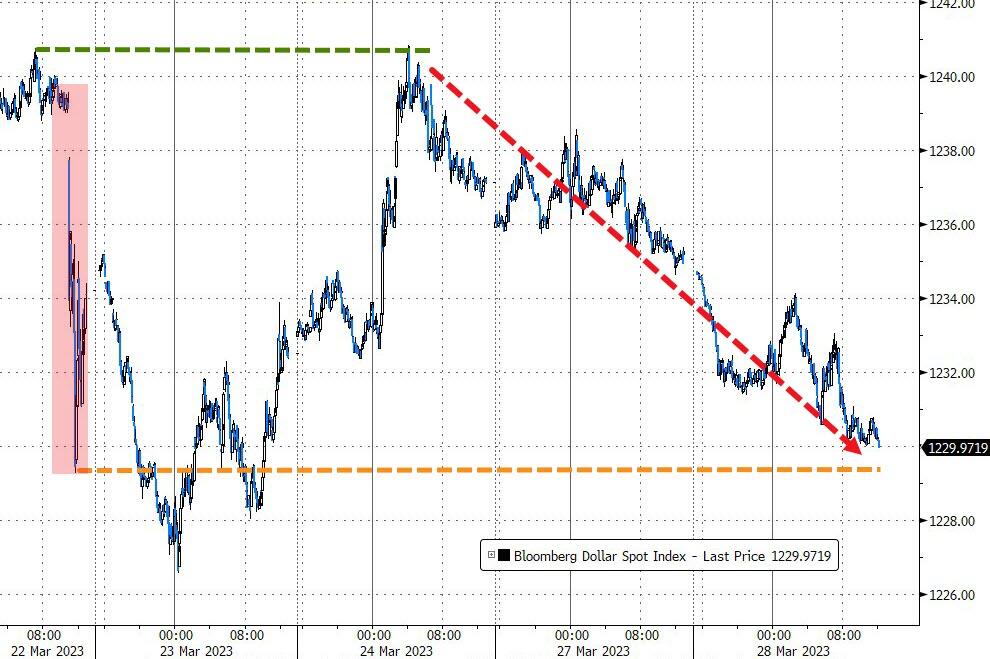
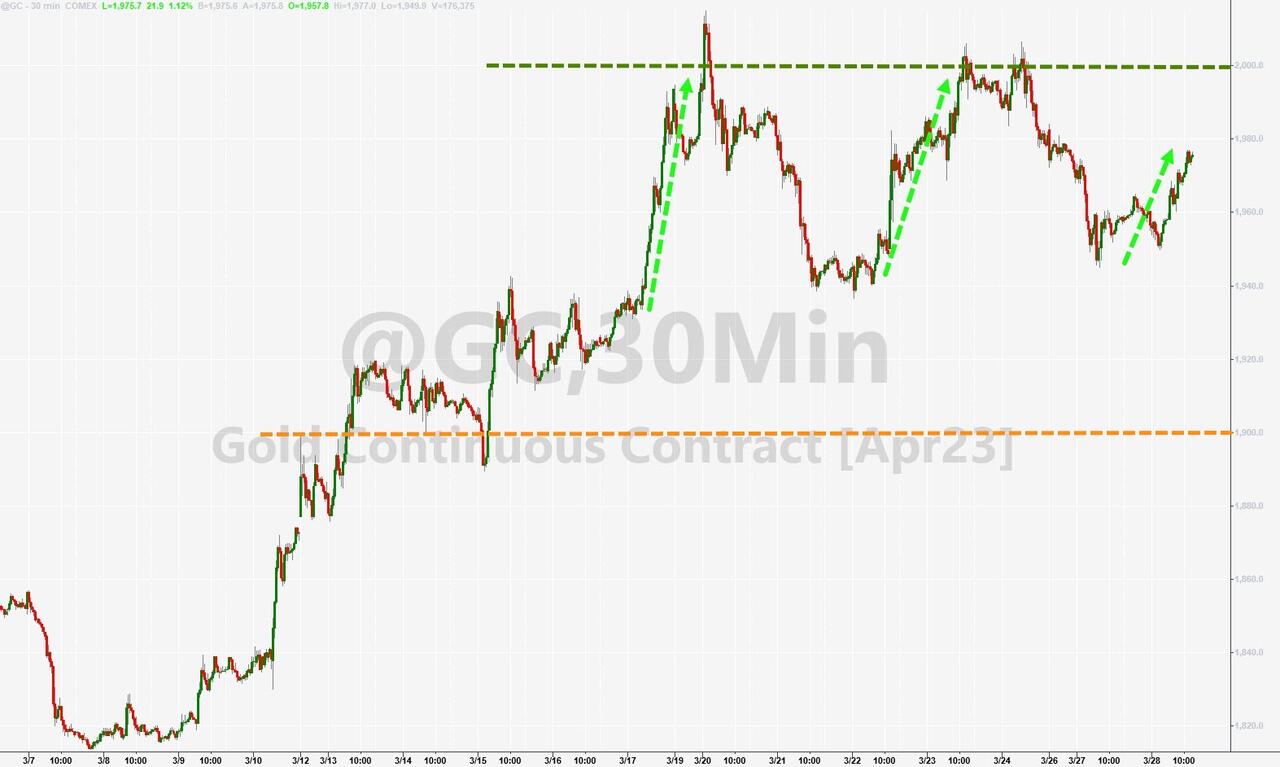
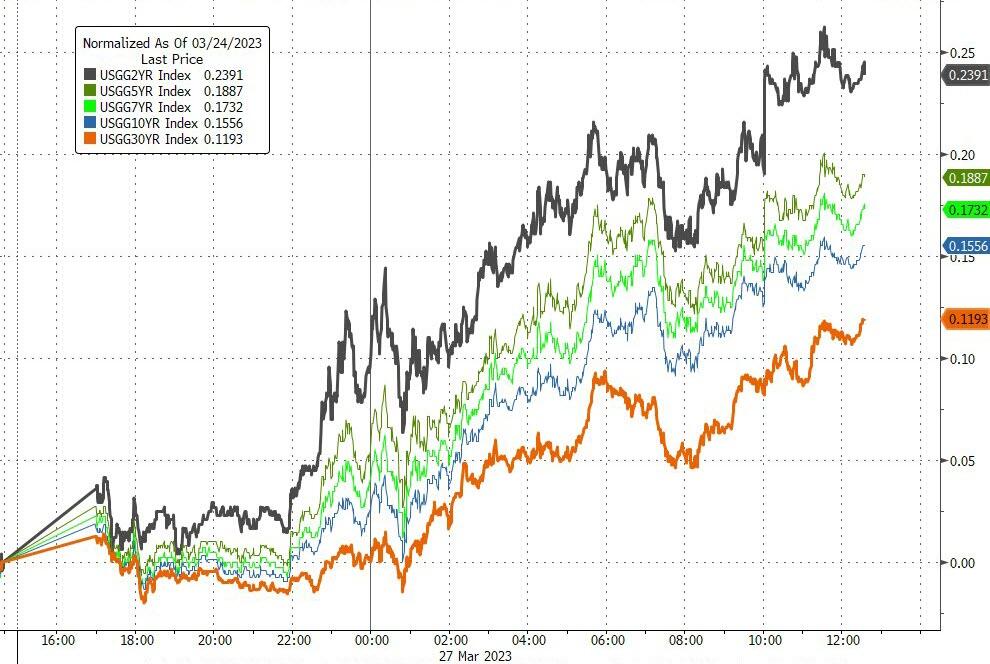
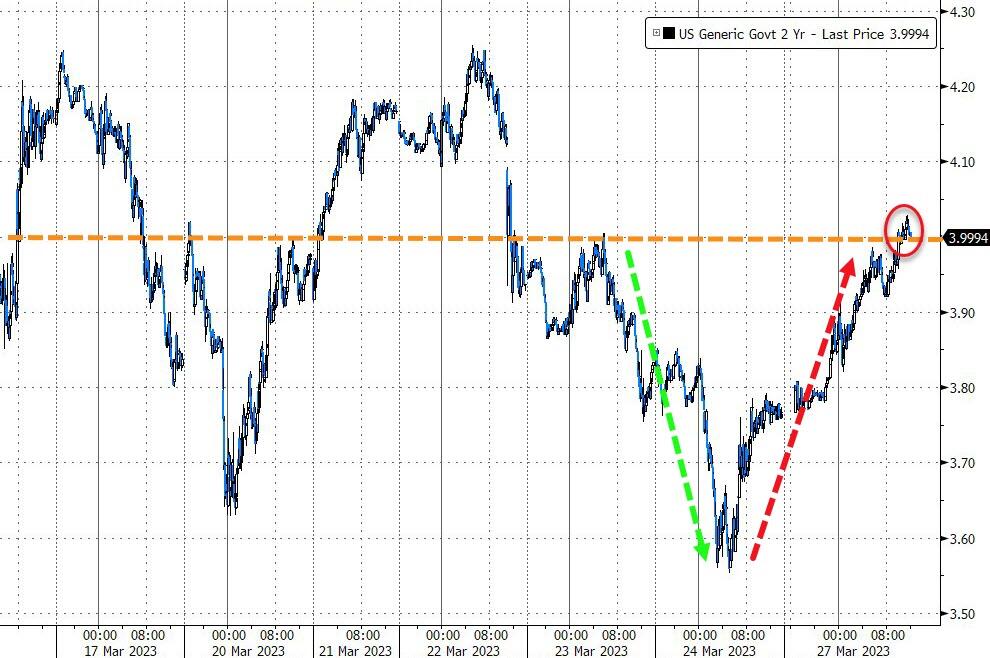
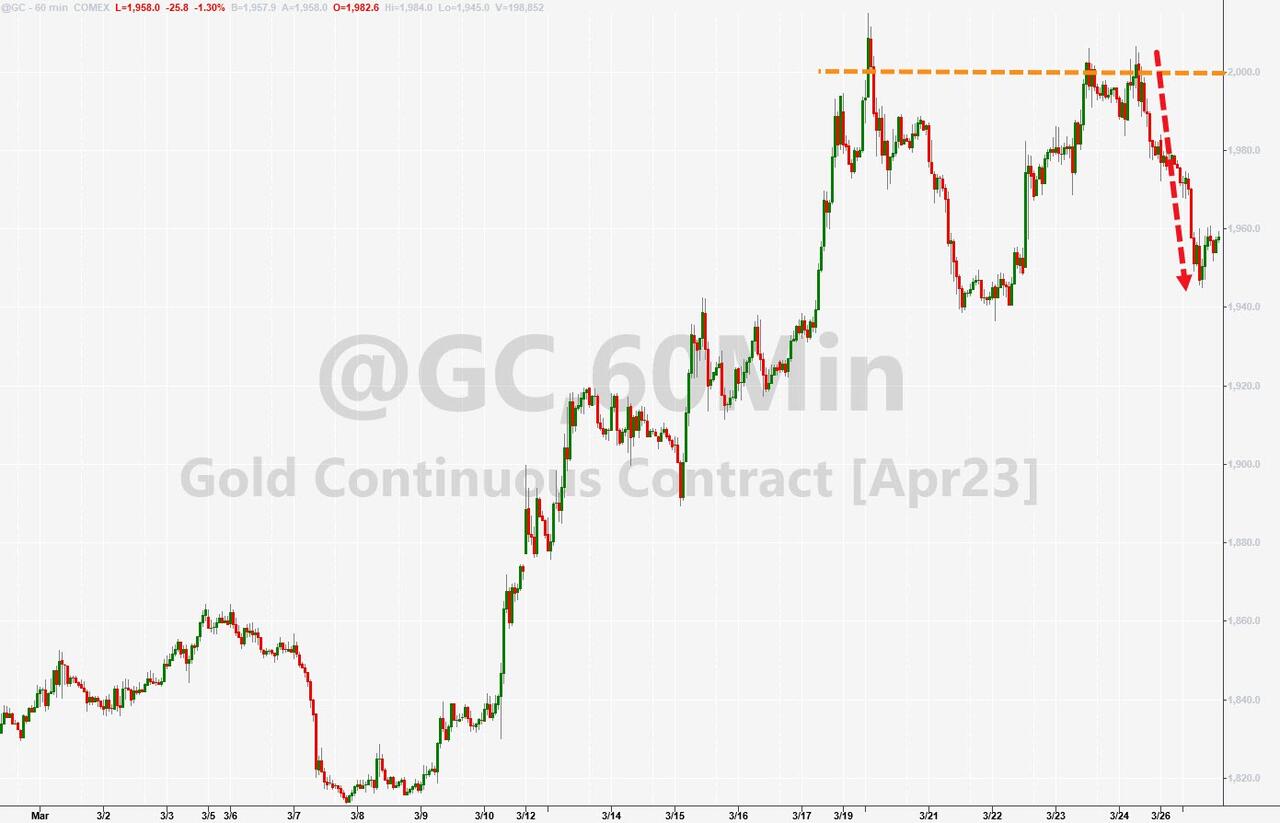
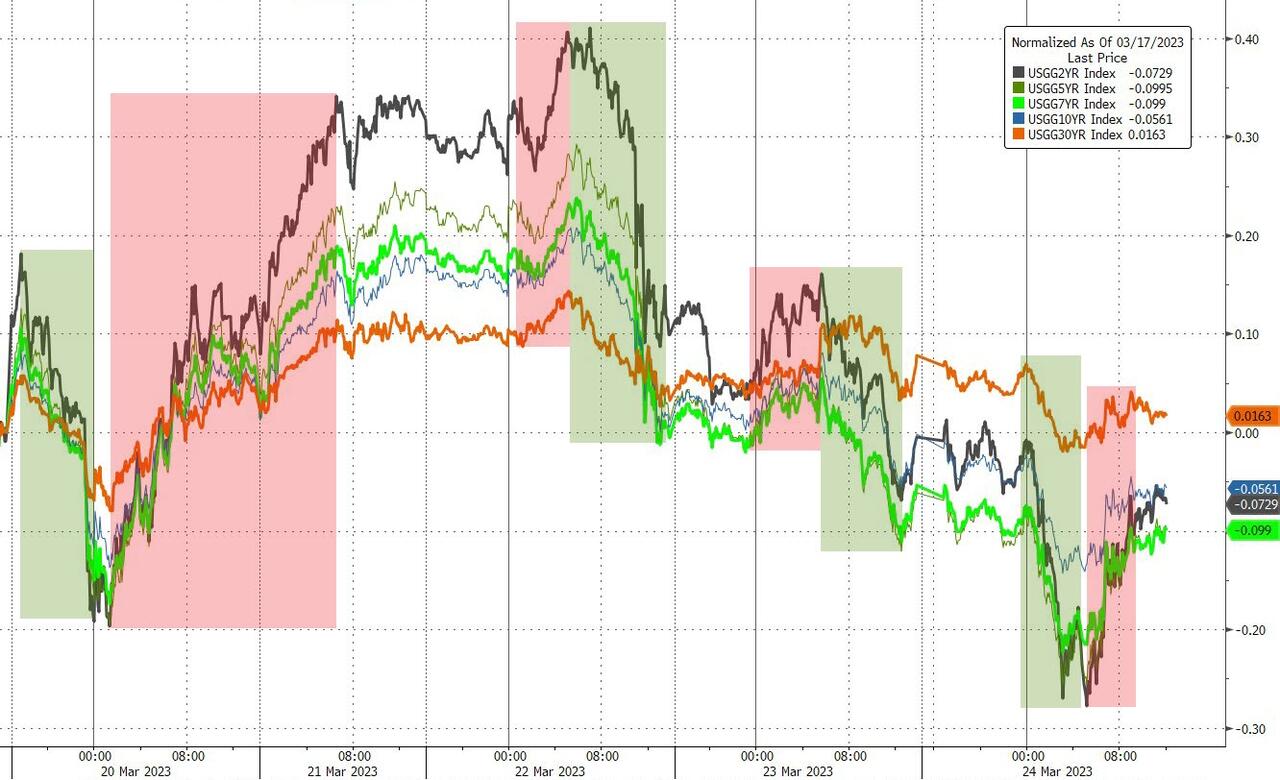
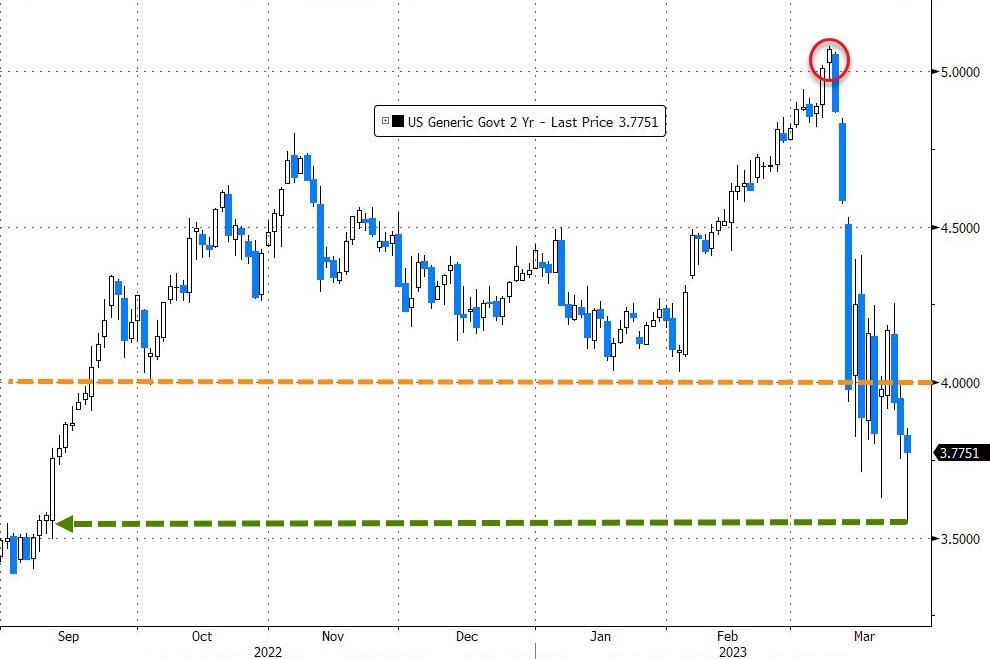
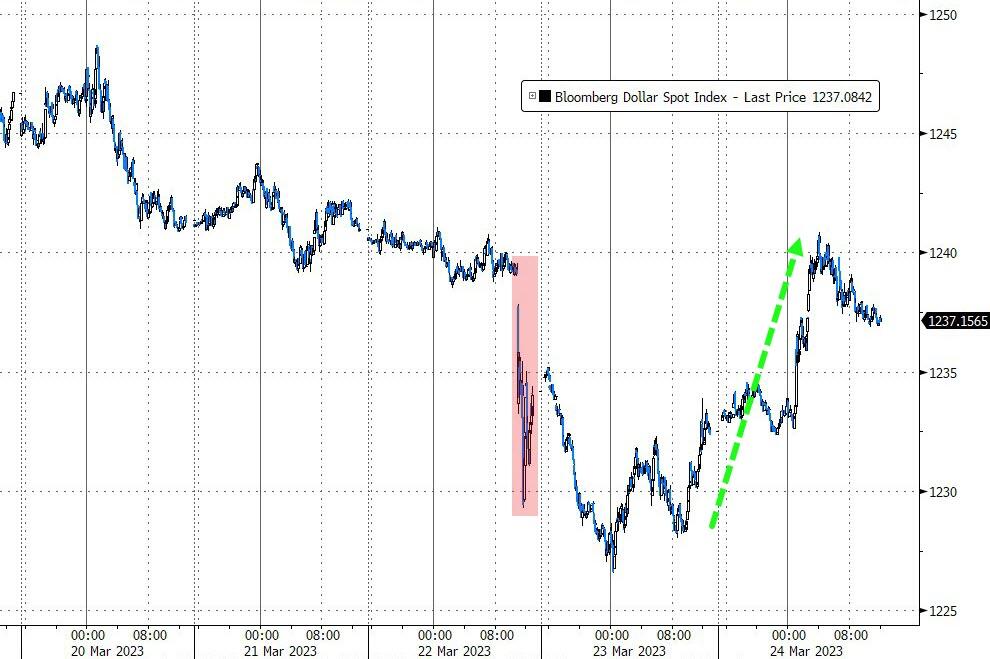
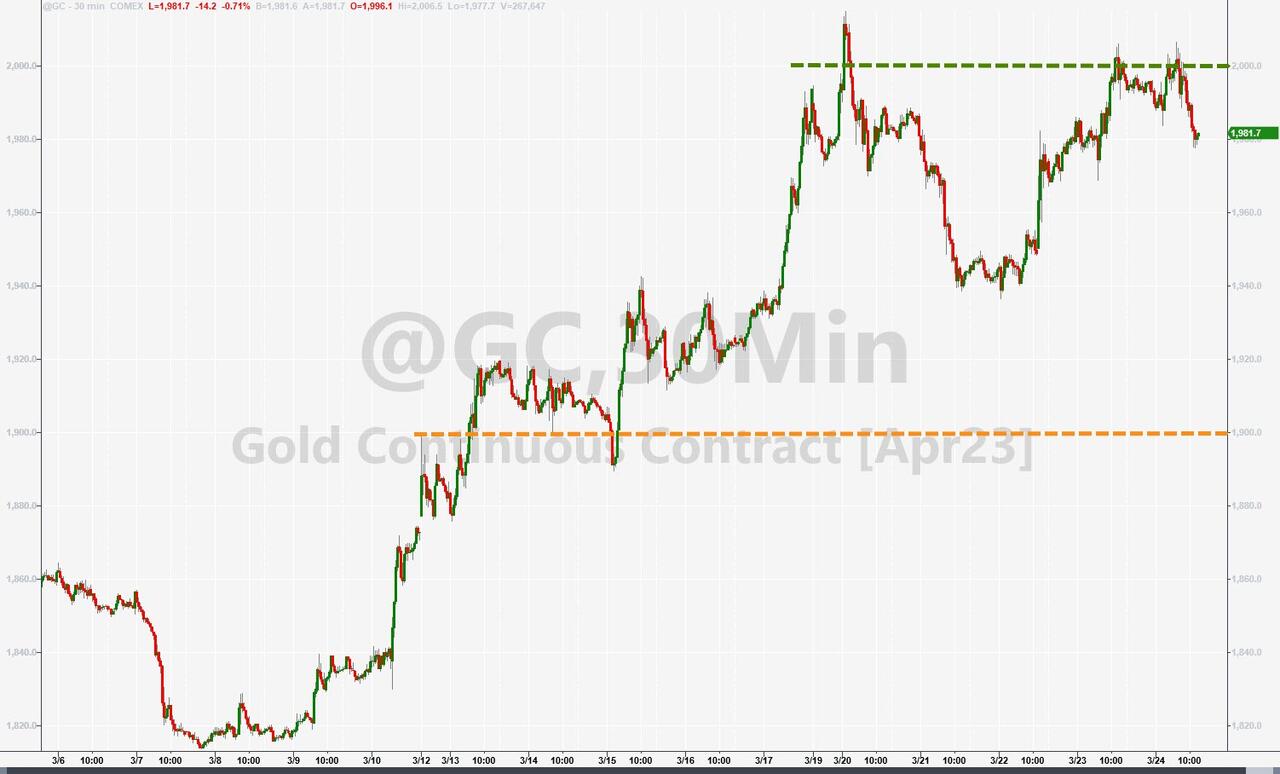
Bond yields slipped a tad, with the 10-year continuing its 3-day sideways pattern. The US Dollar fell to its lowest close since February 3rd, while Gold ripped higher by +1.63% and stopping just short of its $2k level.
Read More