
- Moving the markets
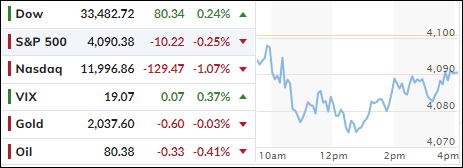
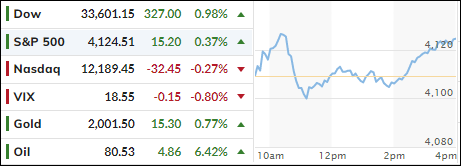
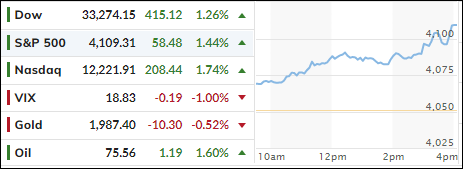
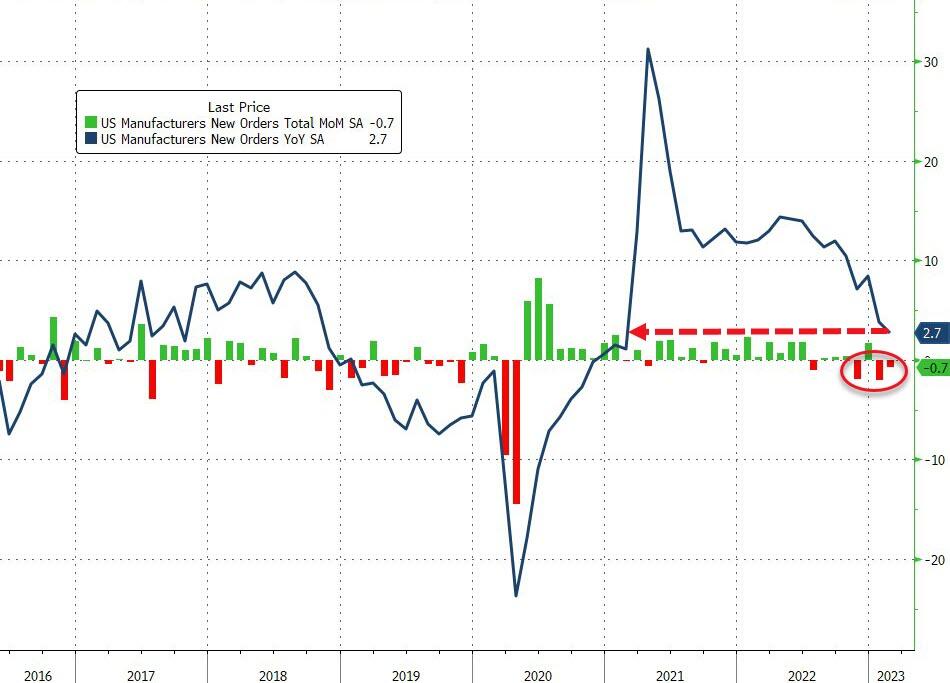
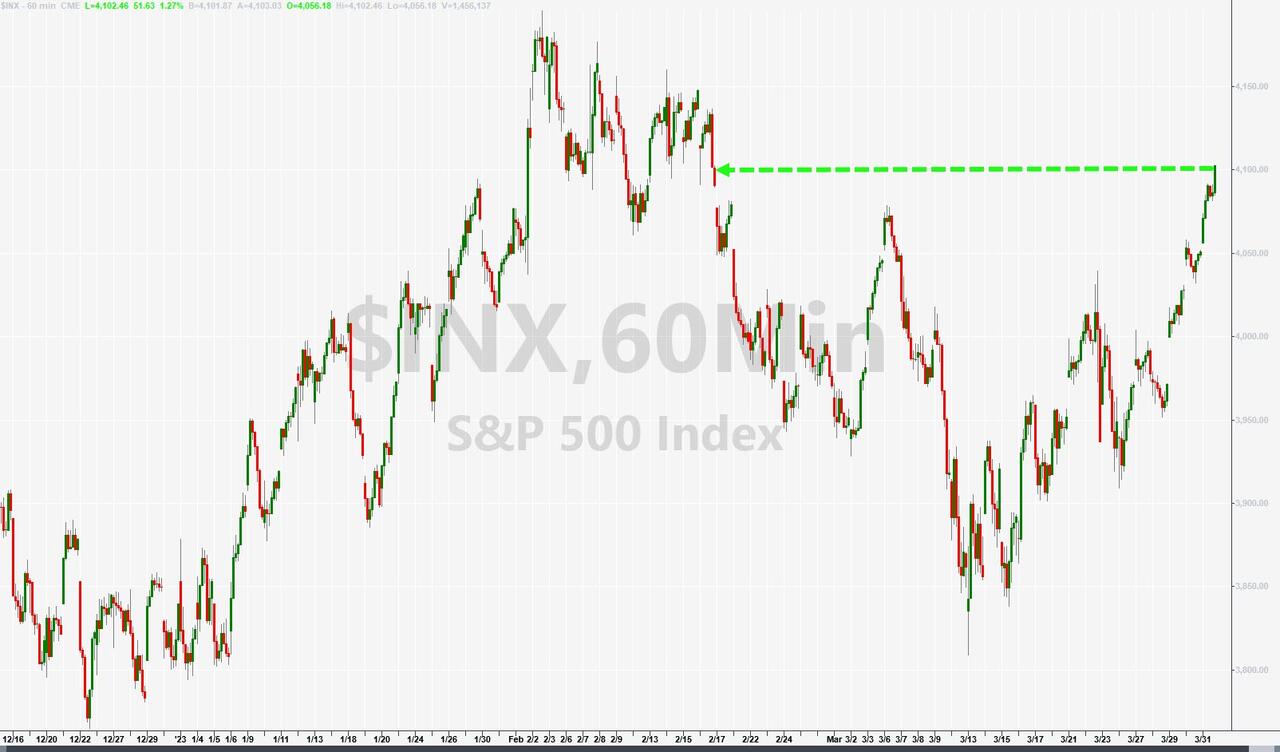
Continued weak economic data points soured traders’ motivation to drive the indexes higher. As a result, the Nasdaq recorded its 3rd straight loss, while only the Dow was able to eke out a green close.
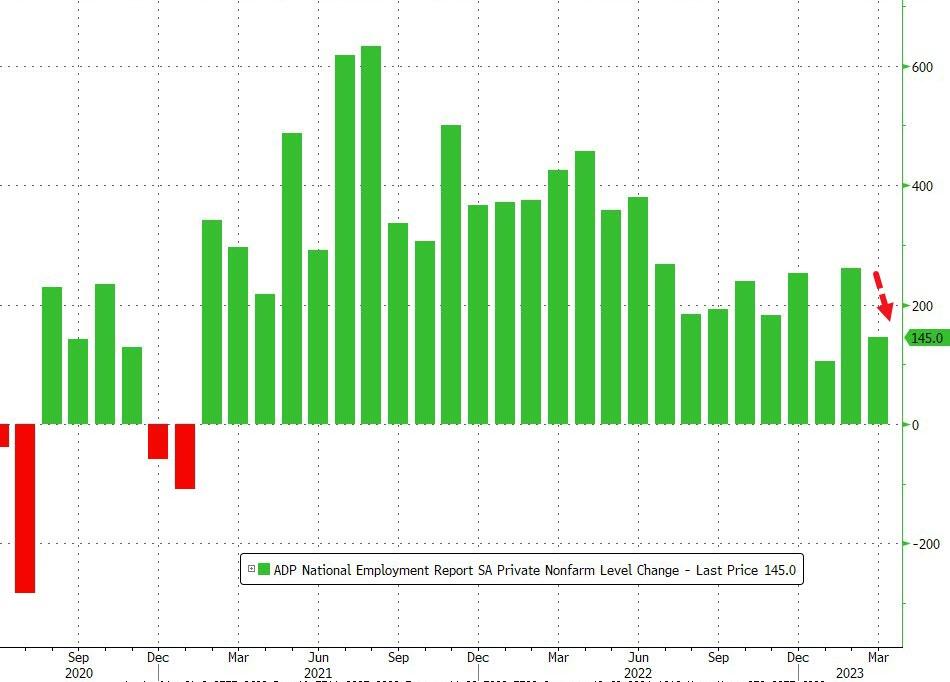
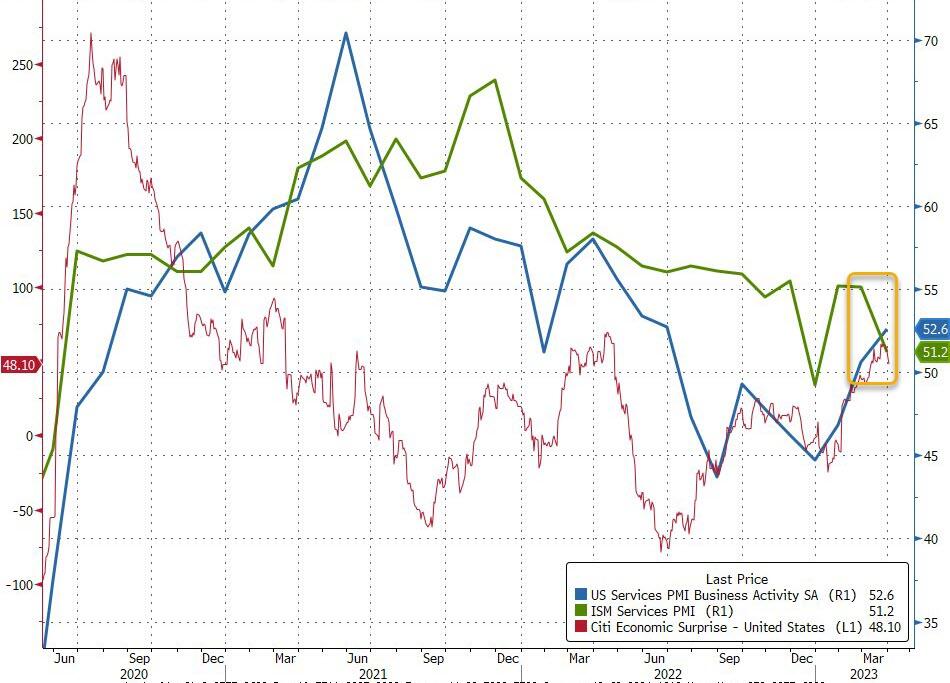
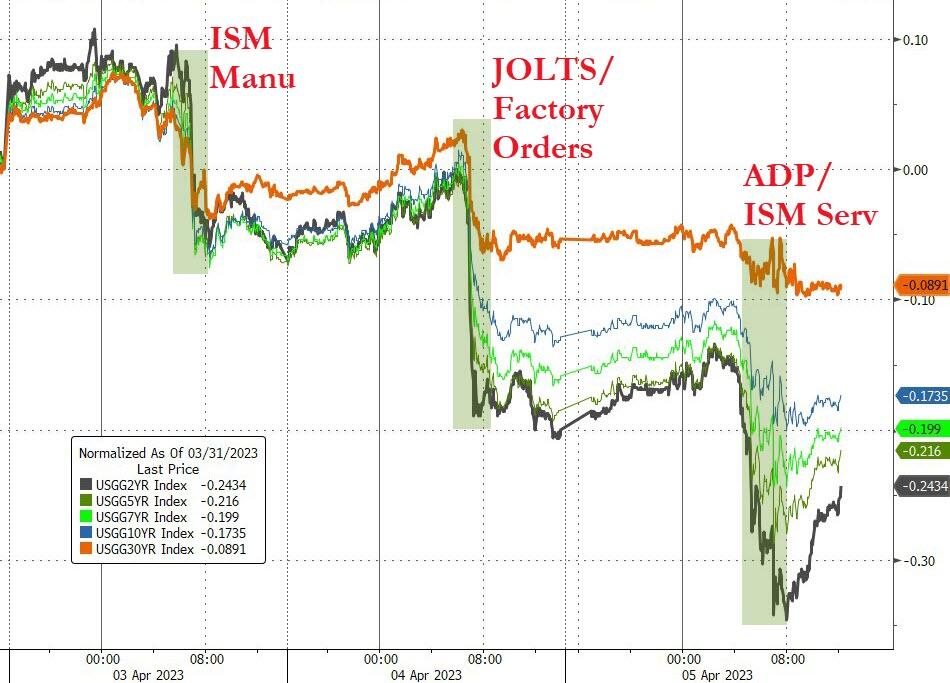
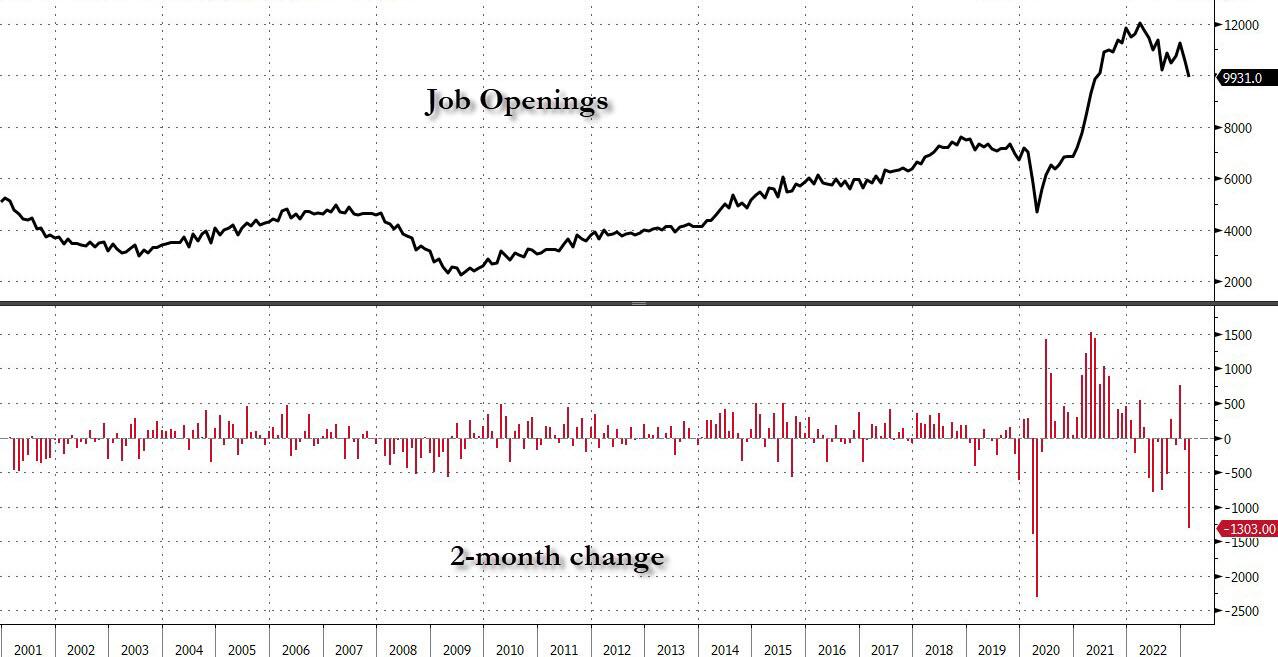
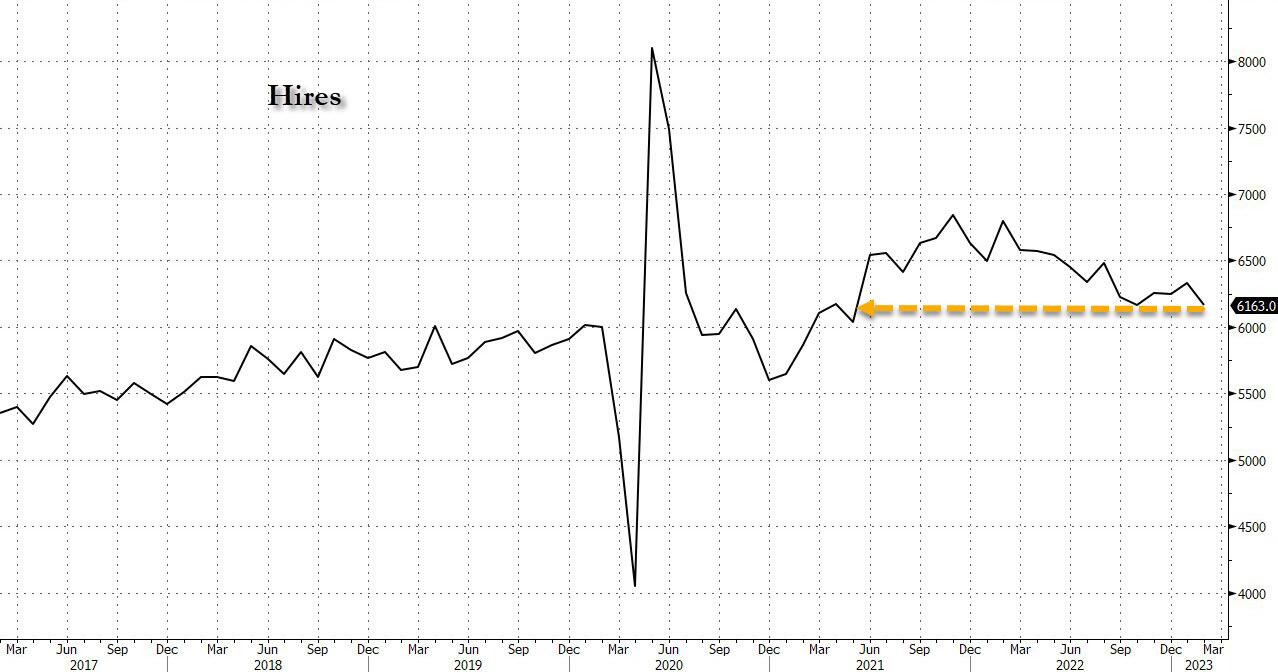
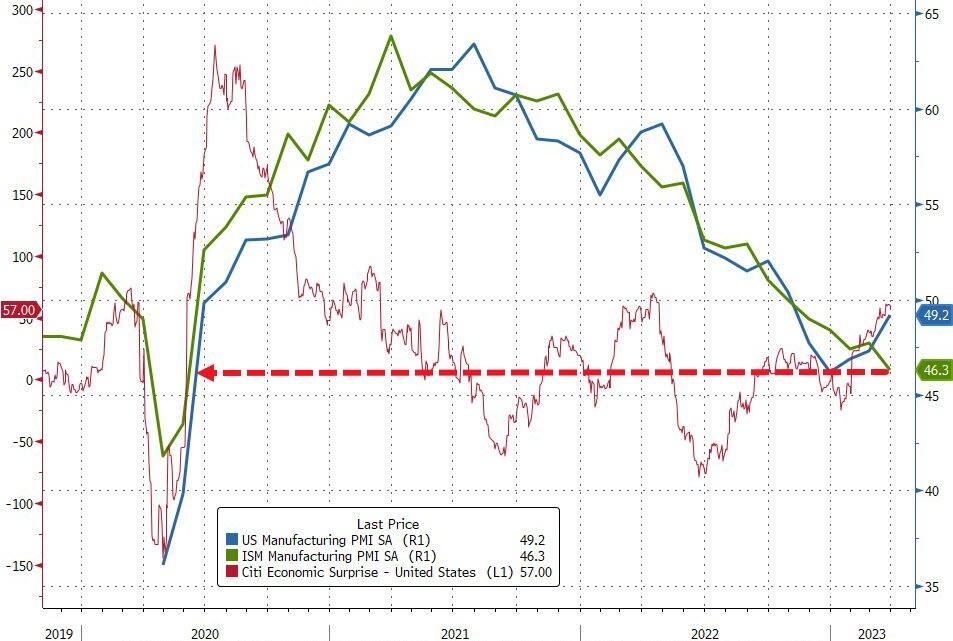
The latest ADP private payroll report was another disappointment, after yesterday’s dreadful data, because it showed slowing job growth. The Services survey also took a dive from 55.1 to 51.2, a huge dip considering the expectations of 54.4.
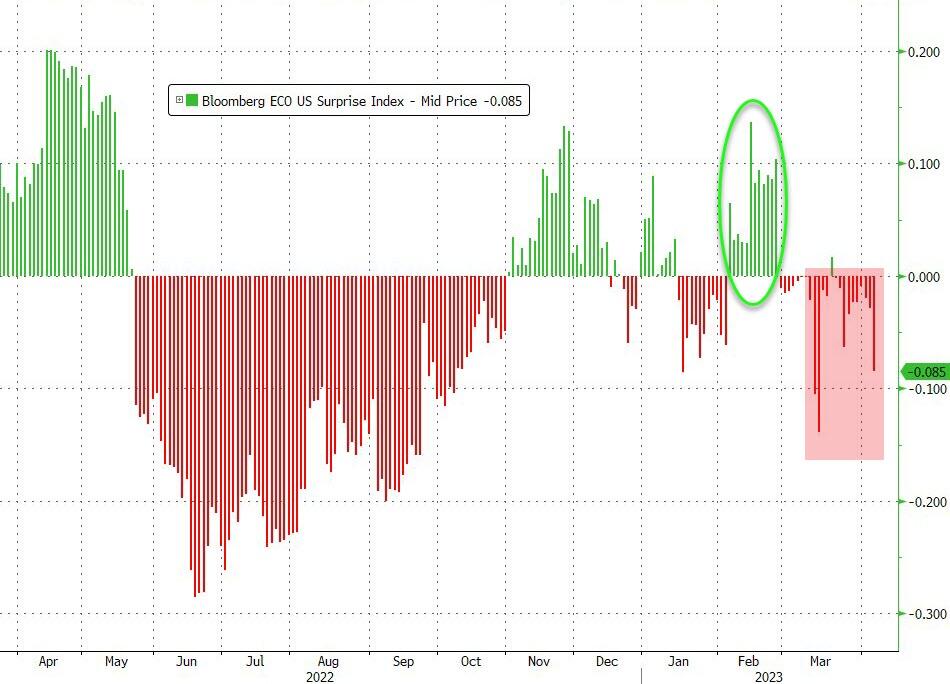
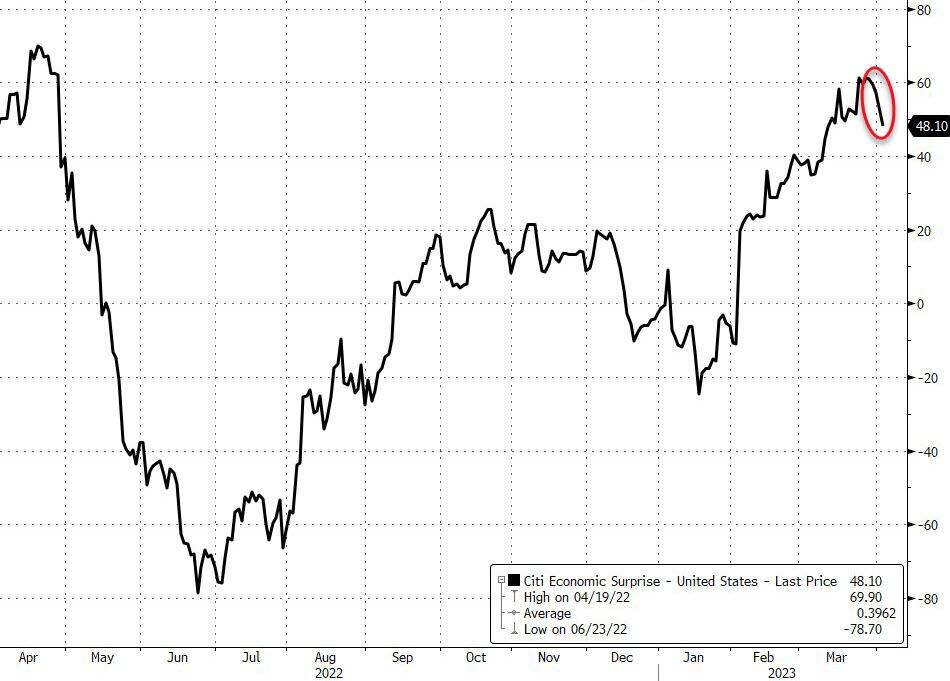
What a difference a month makes. As ZH pointed out, during February, the US Macro Data Surprise Index hovered solidly in green territory, but now this indicator is deeply entrenched in the red, meaning that the much-ballyhooed soft landing may not be playing out as anticipated.
And the Fed’s Loretta Mester was talking out of both sides of her mouth:
Yesterday – MESTER: FED WILL NEED TO GET RATES UP ‘A LITTLE BIT MORE’, SEES FED-FUNDS RATE ABOVE 5%, HOLDING FOR SOME TIME
Today – MESTER: TOO SOON TO SAY WHETHER FED WILL RAISE RATES IN MAY, HOPING WE DON’T TIGHTEN UNTIL SOMETHING BREAKS
Ah yes, a classic case of walking back the talk and shifting from hawkish to dovish.
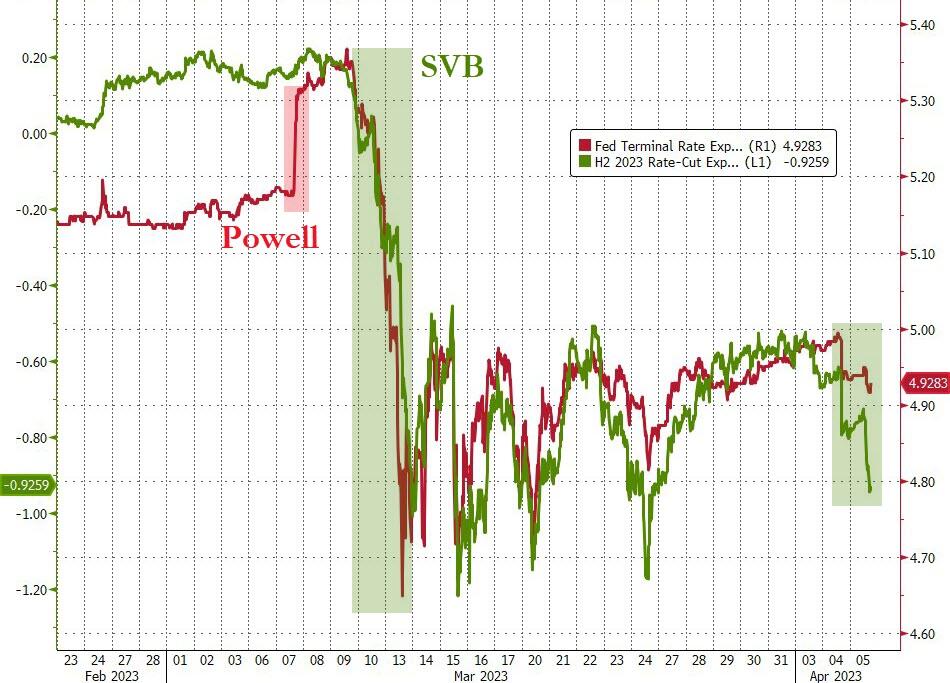
Given the weakening economic environment, the markets are now counting on lower rates ahead with a Terminal Rate of 4.9% in May, which is to be followed by 4 rate cuts to 4% by the end of this year. Of course, this is not chiseled in stone, and a host of events could derail these assumptions.
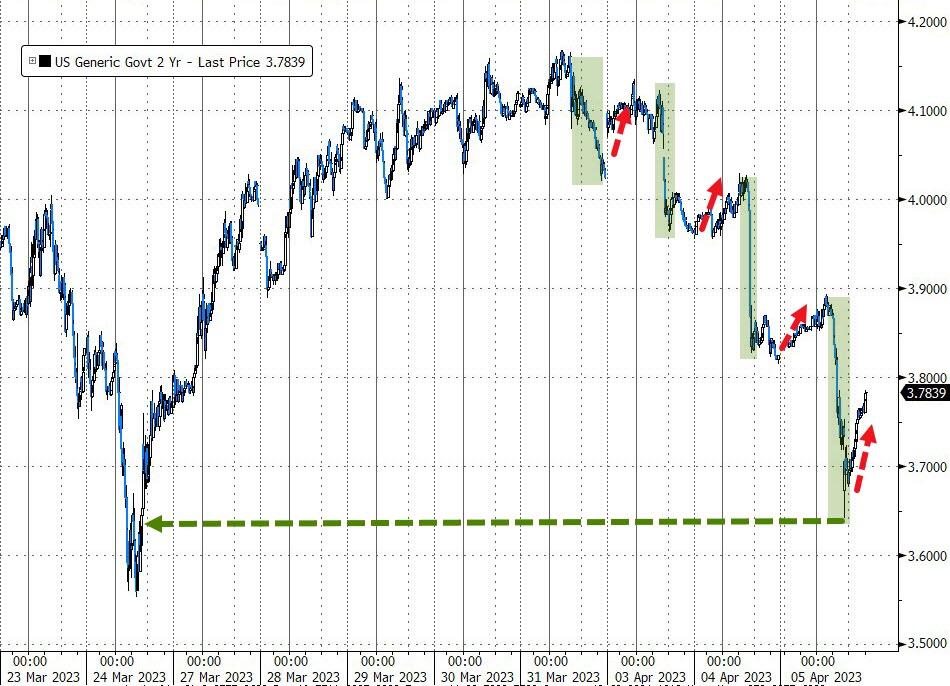
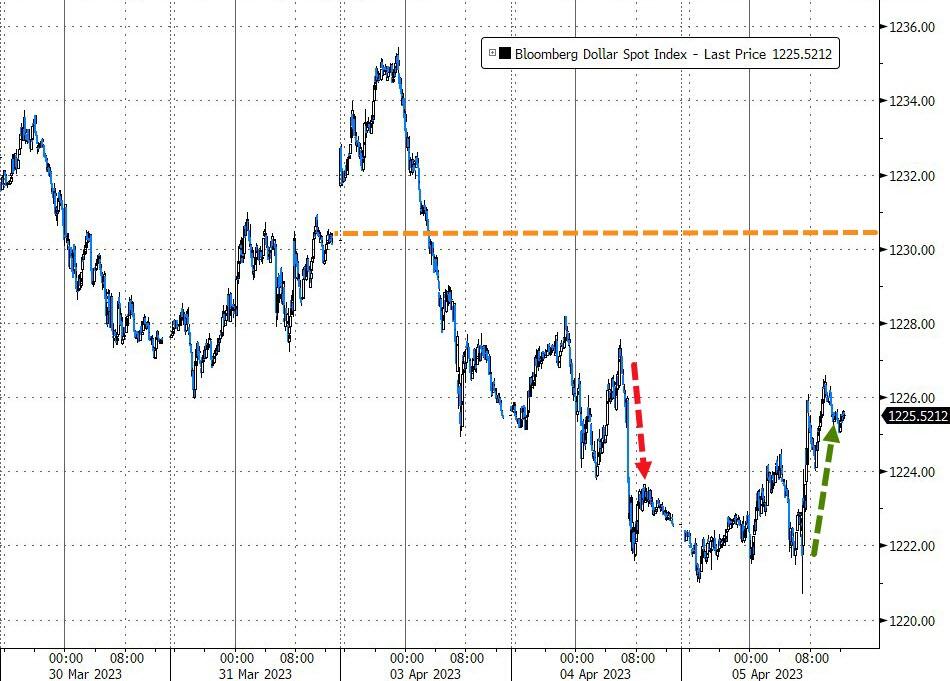
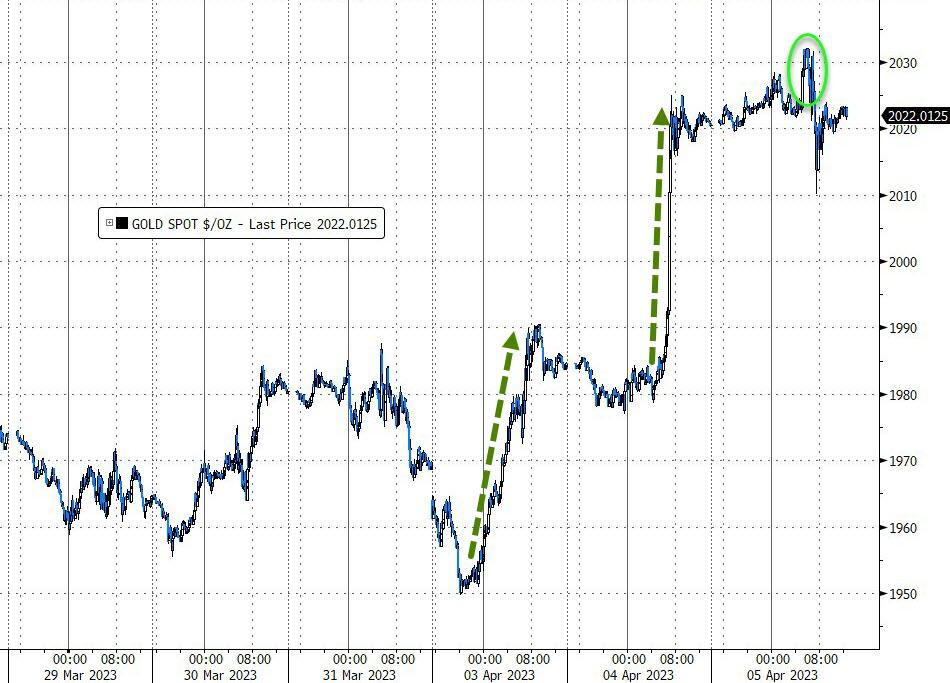
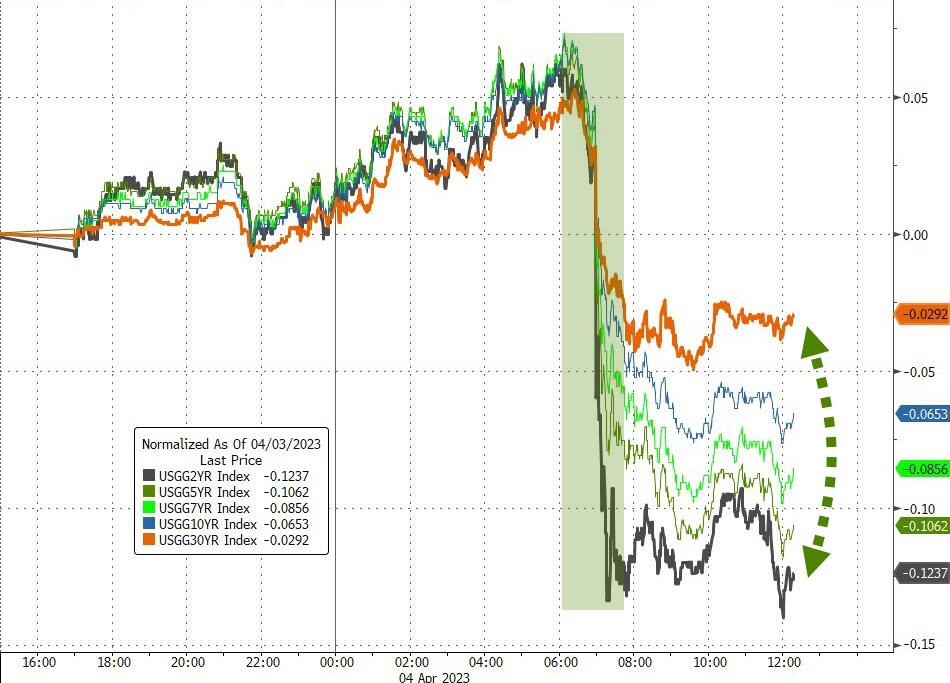
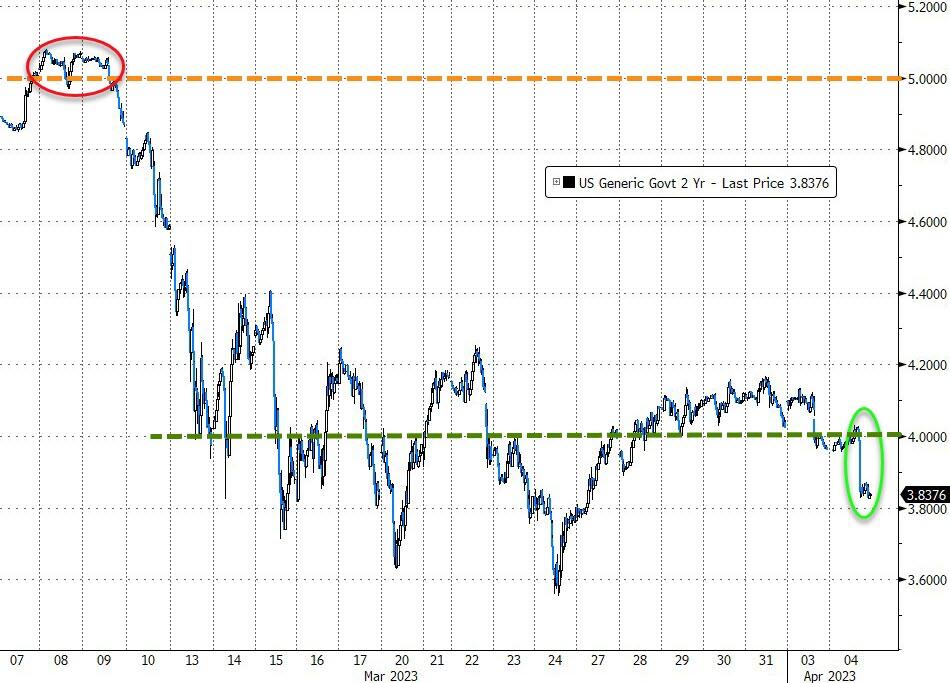
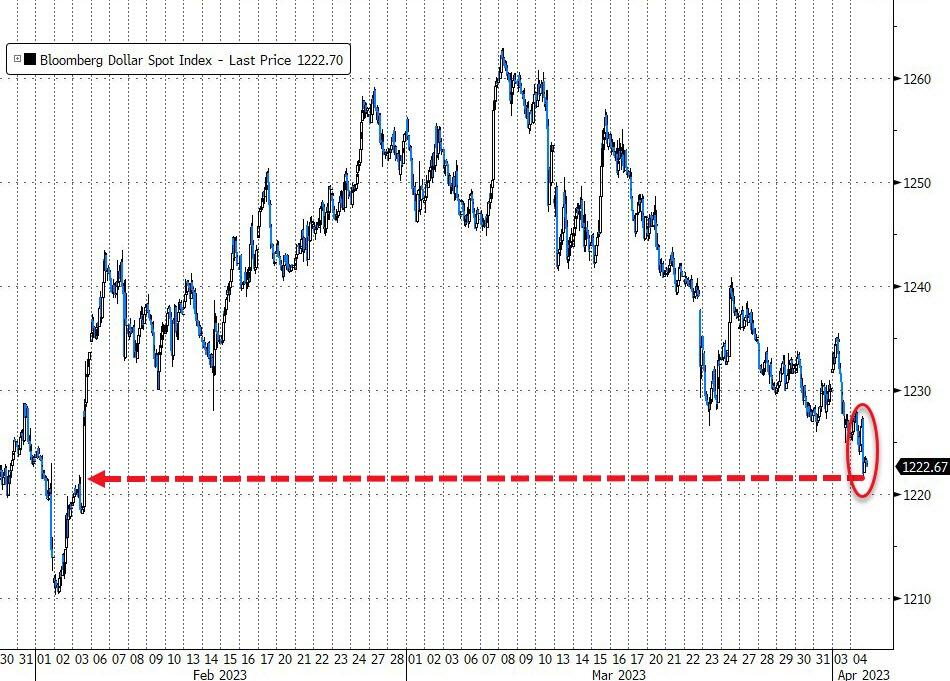
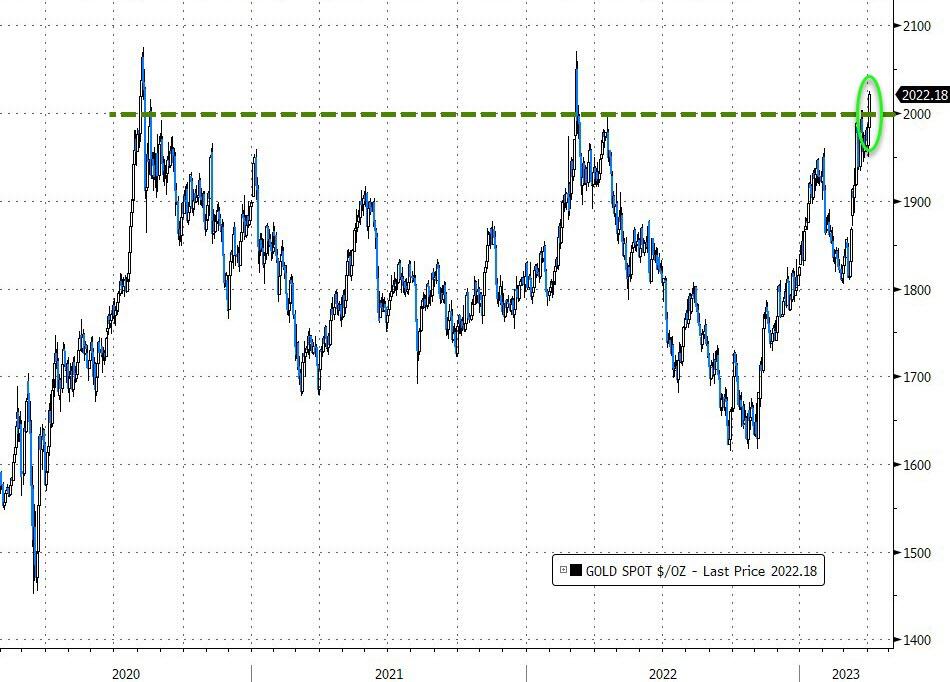
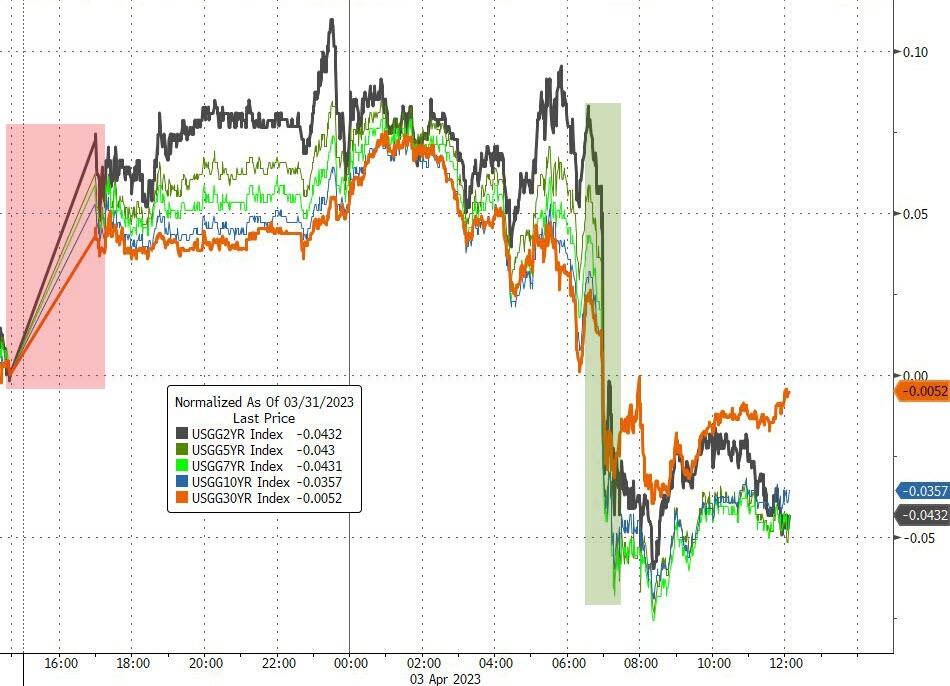
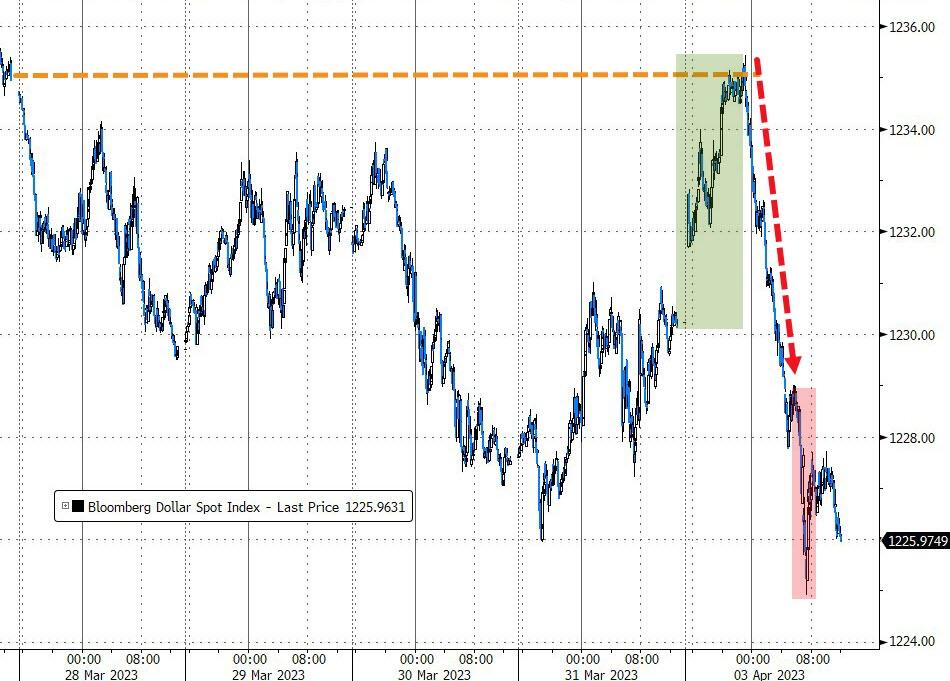
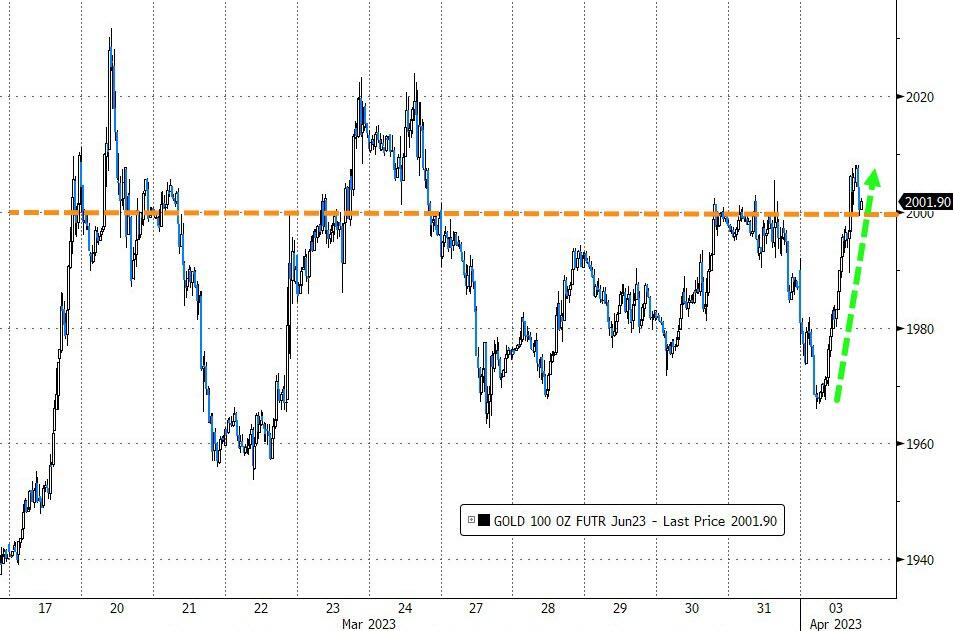
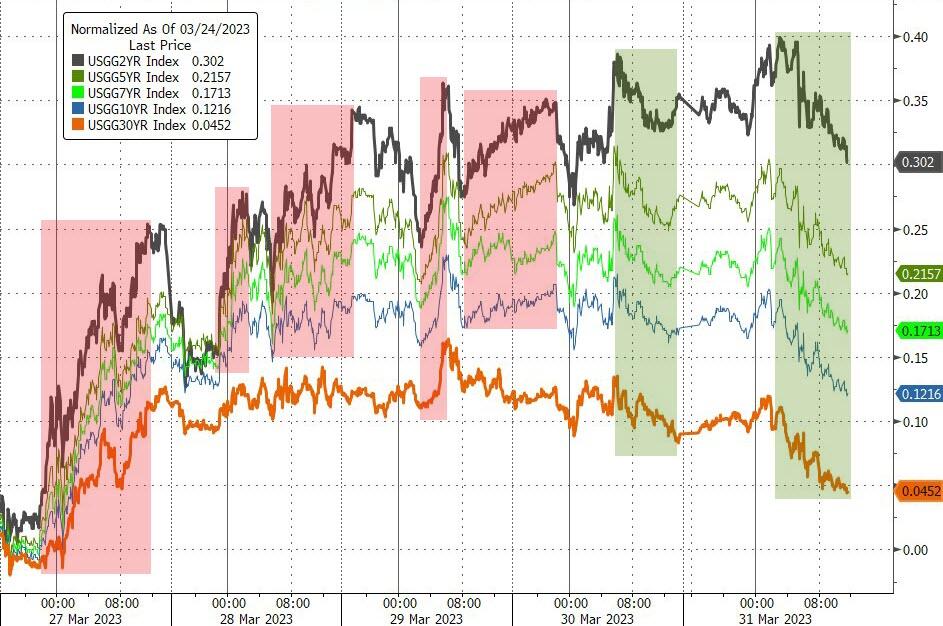
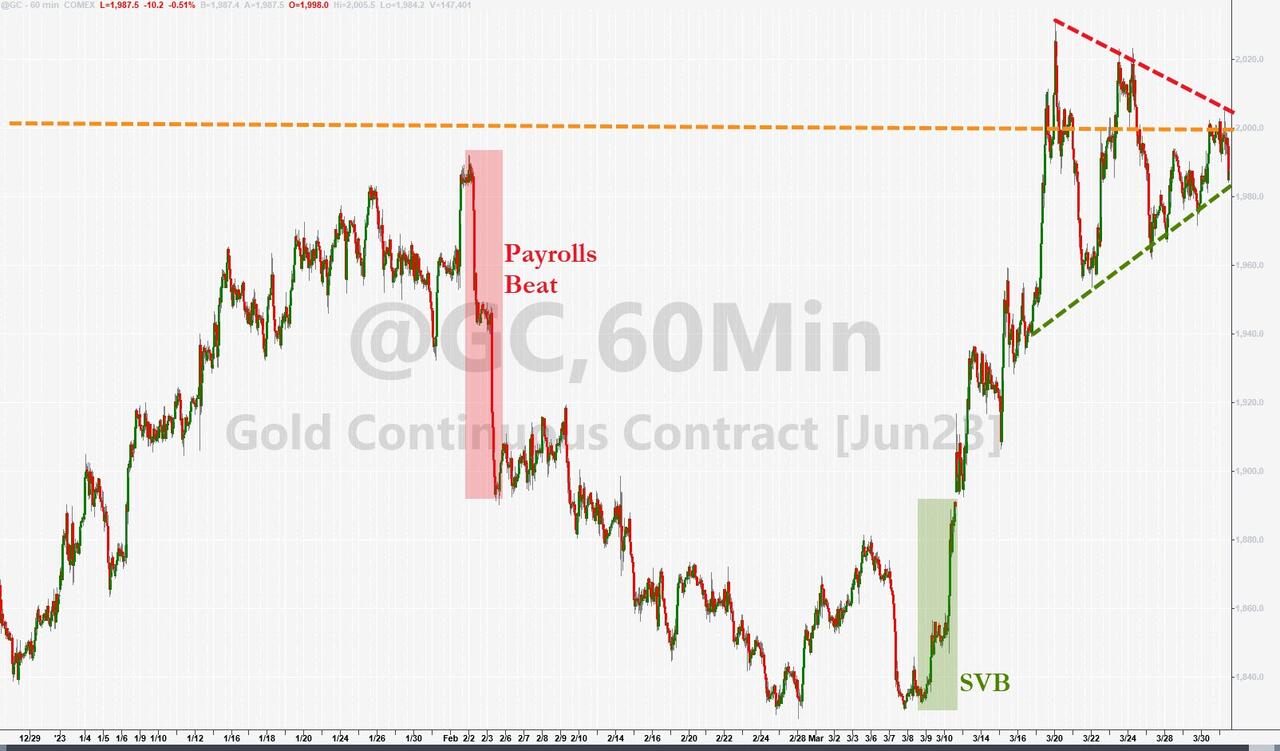
Bond yields dumped after the ADP release, with the 2-year first retreating to 3.64% before rebounding to 3.8%. Despite the overall dovish sentiment, the US Dollar bounced back moderately, as Gold surpassed $2,030 but pulled back to end the session at $2,037, essentially unchanged.
Tomorrow will be the last trading day of this week, due to markets being closed on Good Friday.
Read More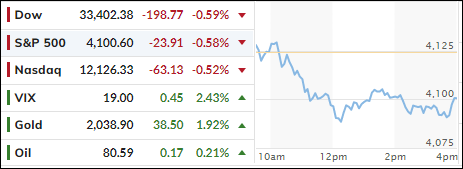
