
- Moving the markets
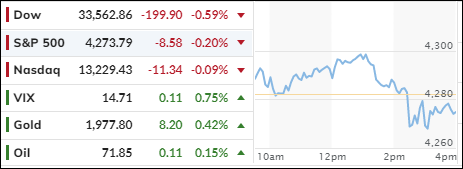
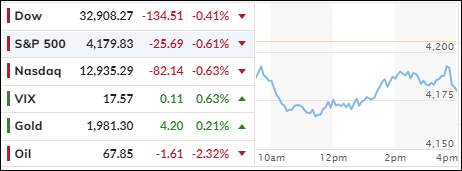
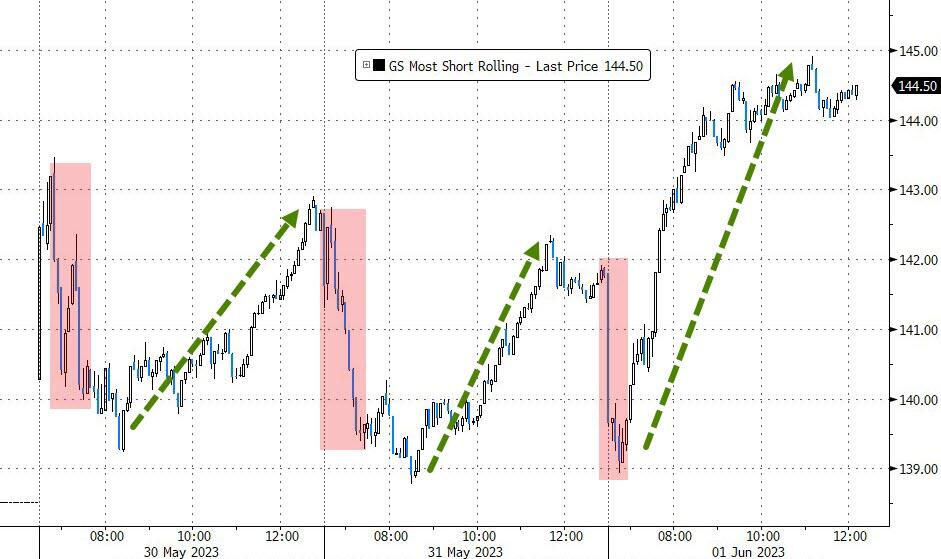
The market rally fizzled out on Monday as the major indexes gave up their early gains and closed nearly flat or lower. The Dow was the biggest loser, while the S&P 500 and Nasdaq barely stayed above water. According to Bespoke Investment Group, the S&P 500 is now more overbought than any time since July 2021. Yikes!
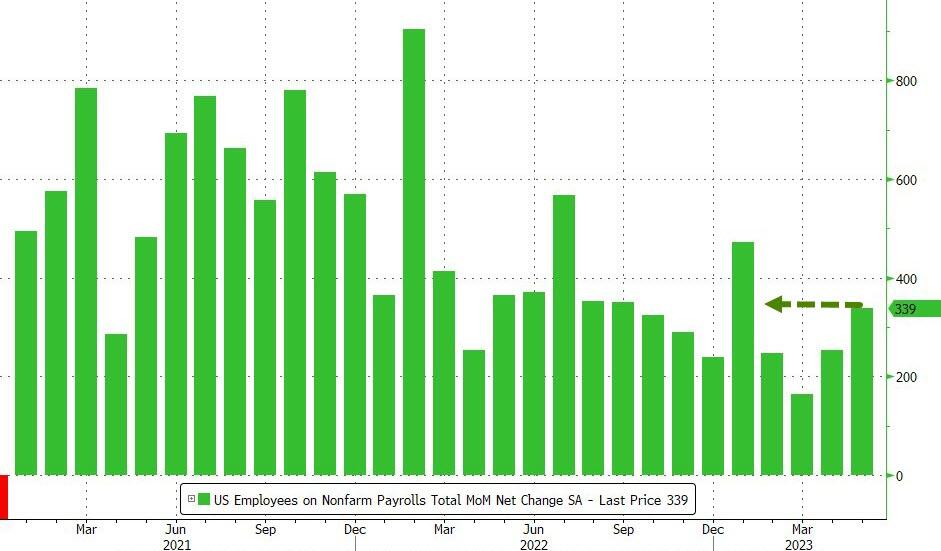
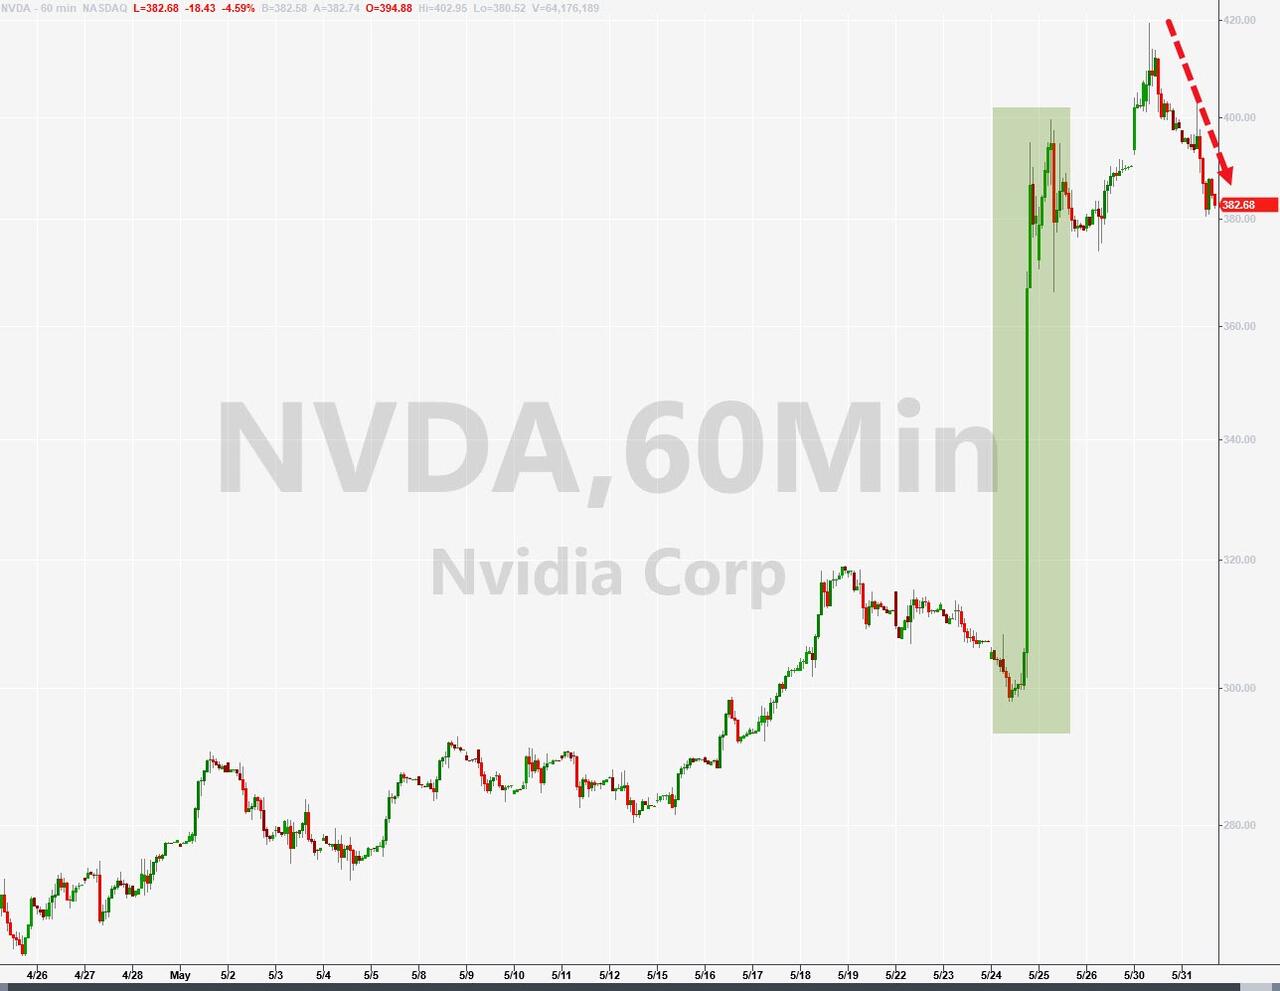
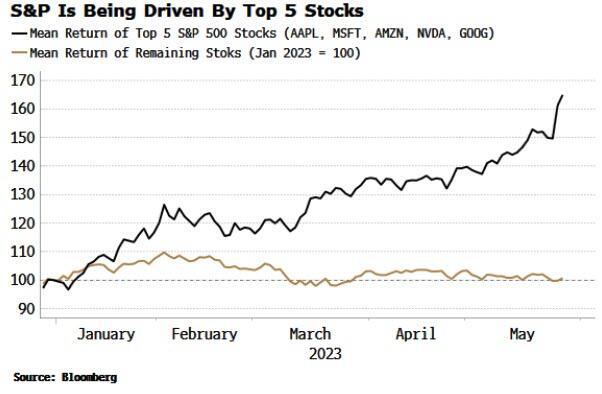
It was a slow day for traders, who had little to cheer about after last week’s debt ceiling drama and the bizarre jobs report that raised more questions than answers. Some analysts wondered if the rally was too narrow and too fragile, relying on a few stocks to prop up the market.
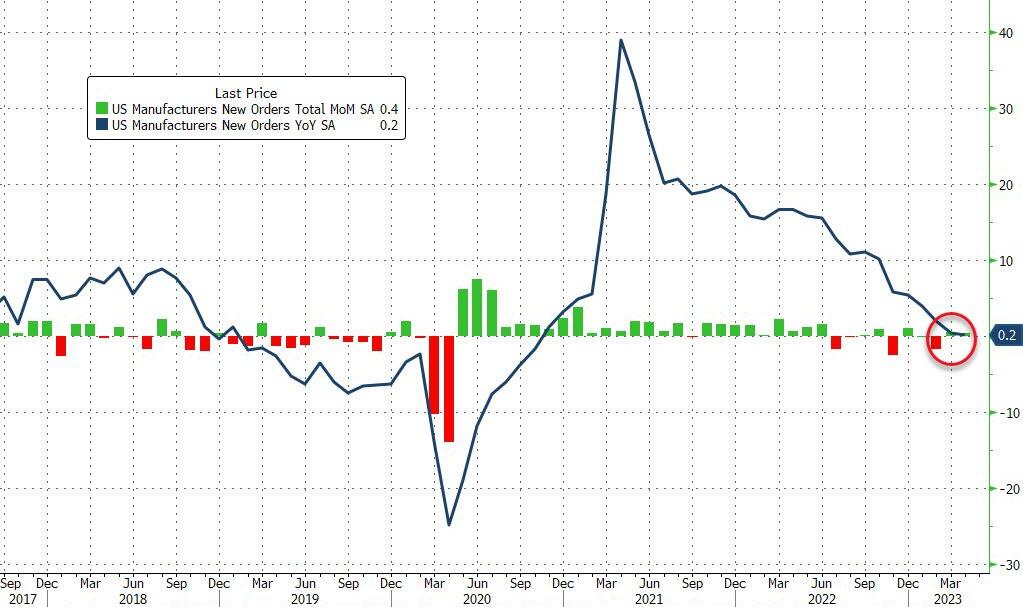
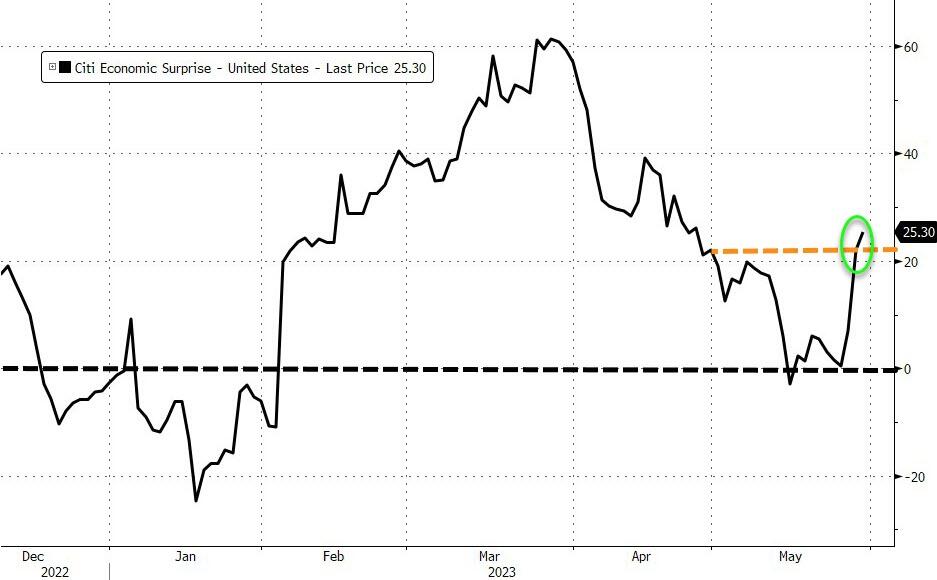
The economic news was not encouraging either. US factory orders grew by a measly 0.4% in April, half of what was expected, and the previous month’s figure was revised down. The services sector also disappointed, showing signs of slowing down. How can anyone still claim that the economy is doing fine and there is no risk of a recession?
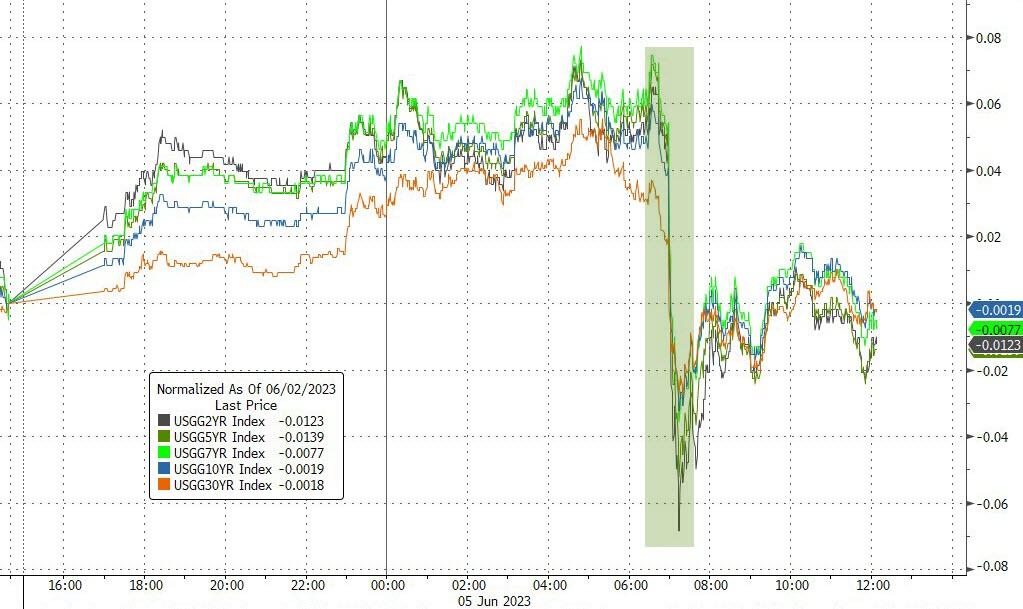
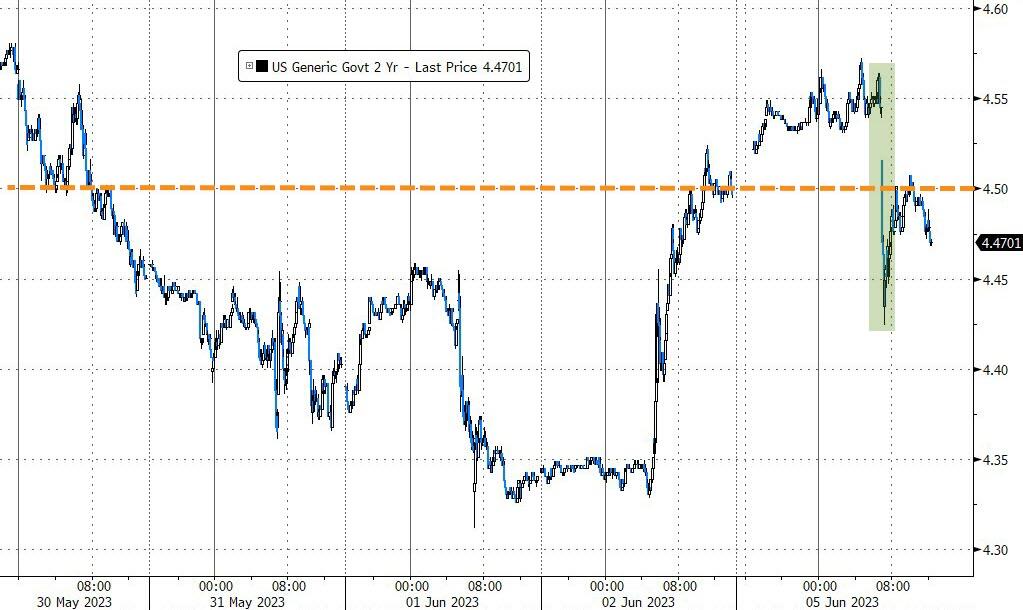
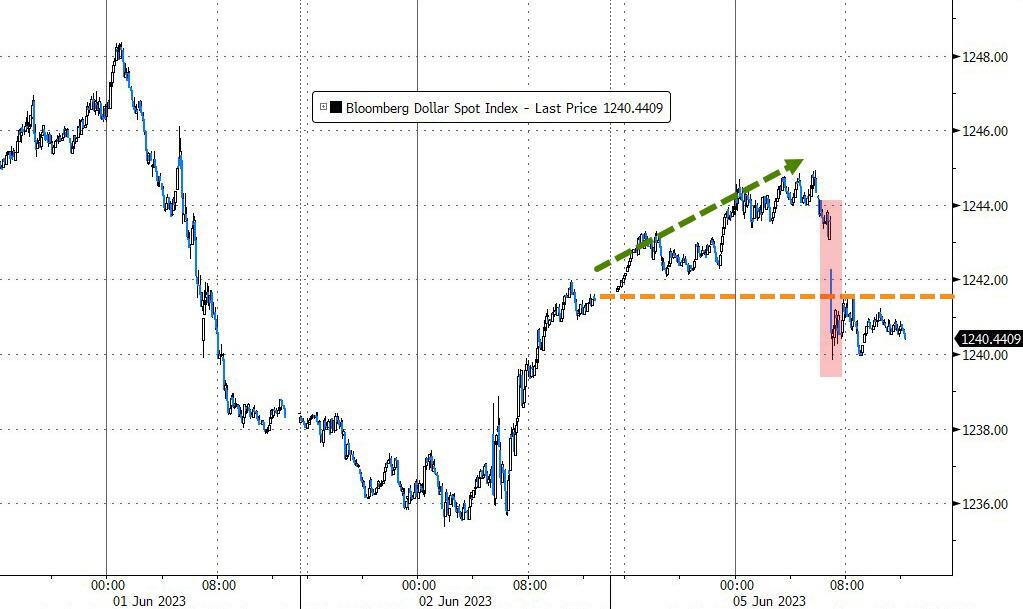
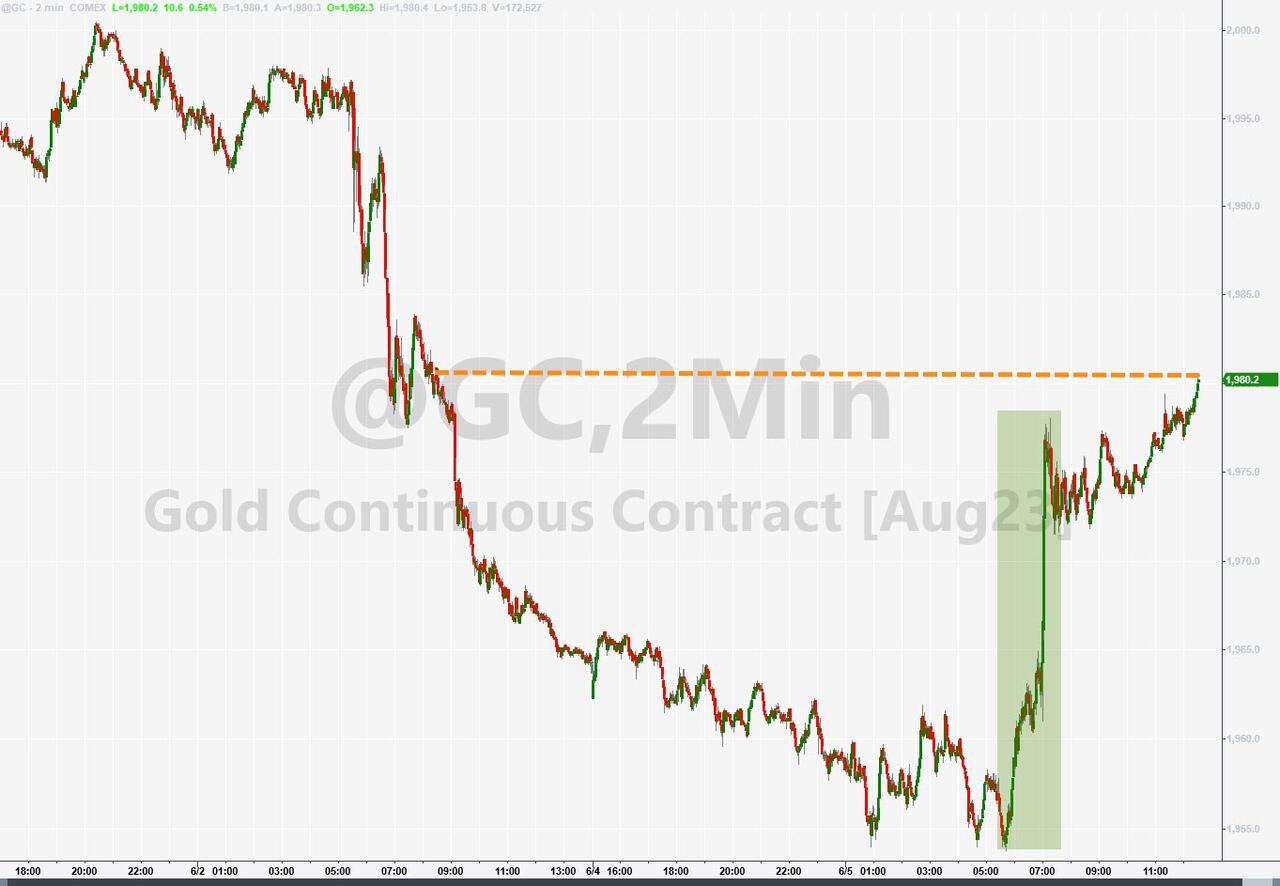
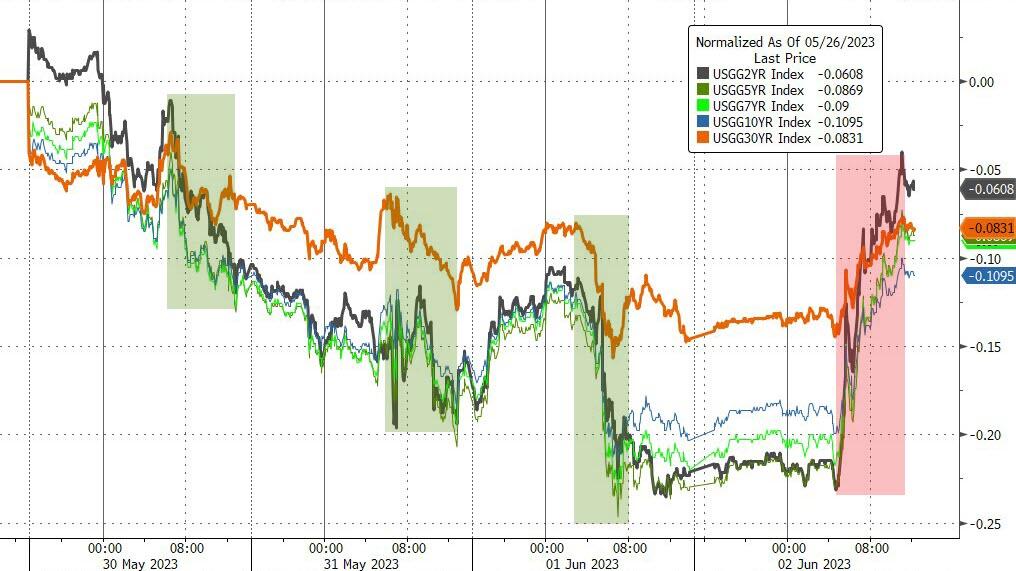
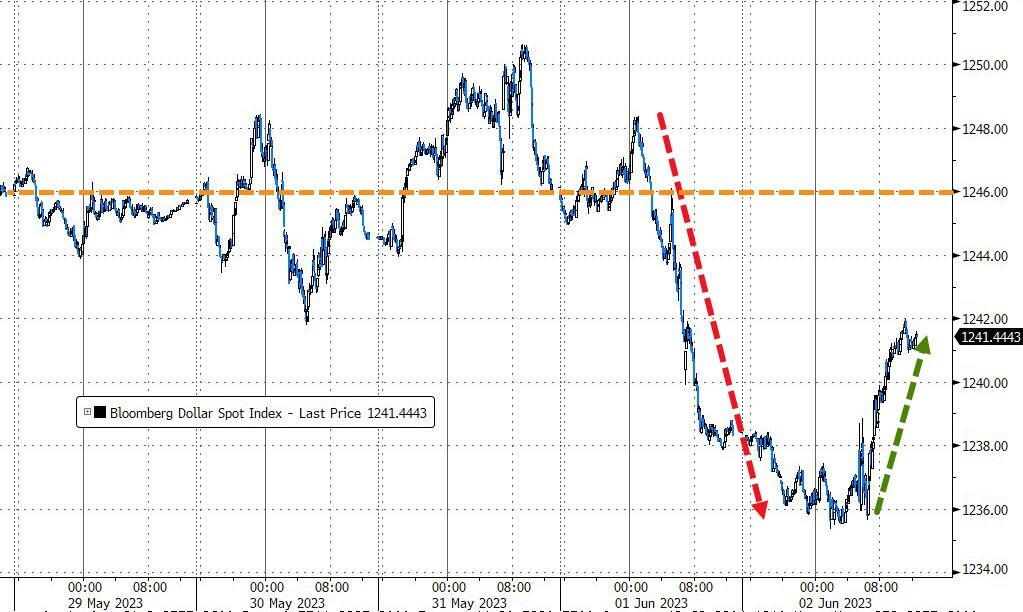
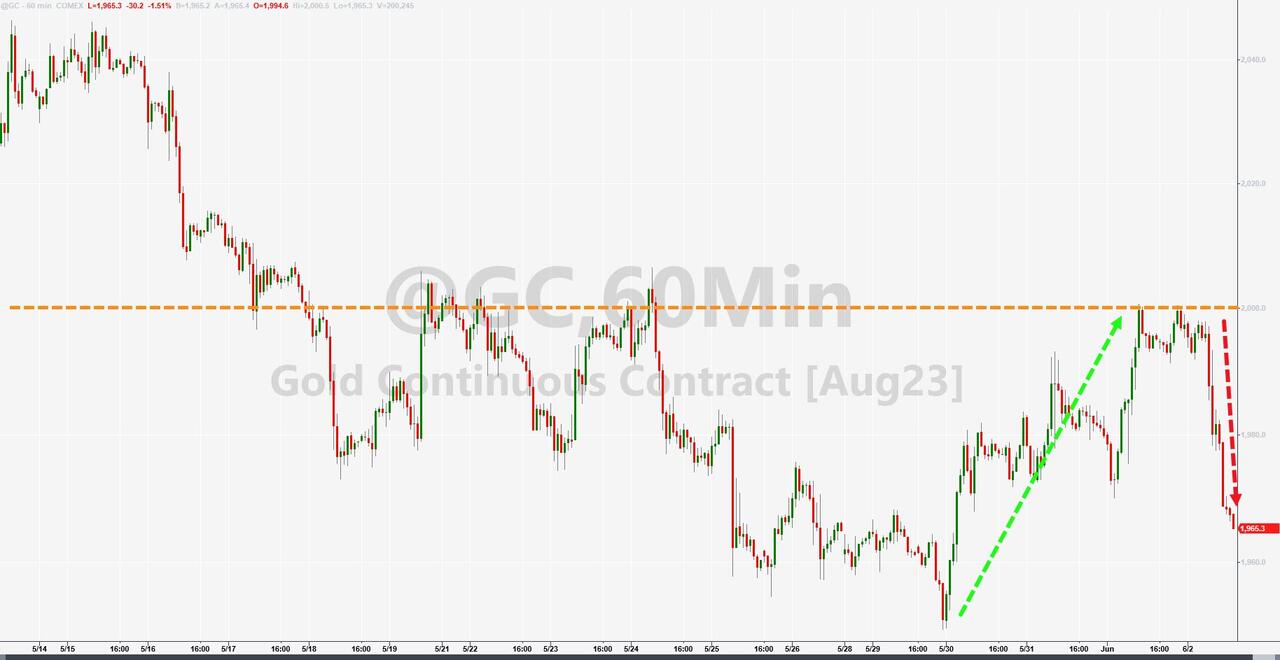
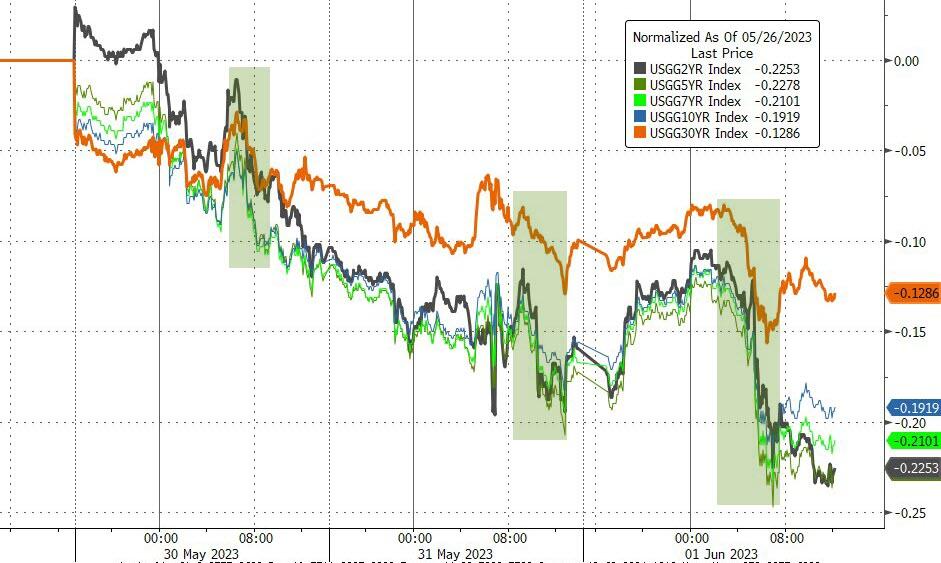
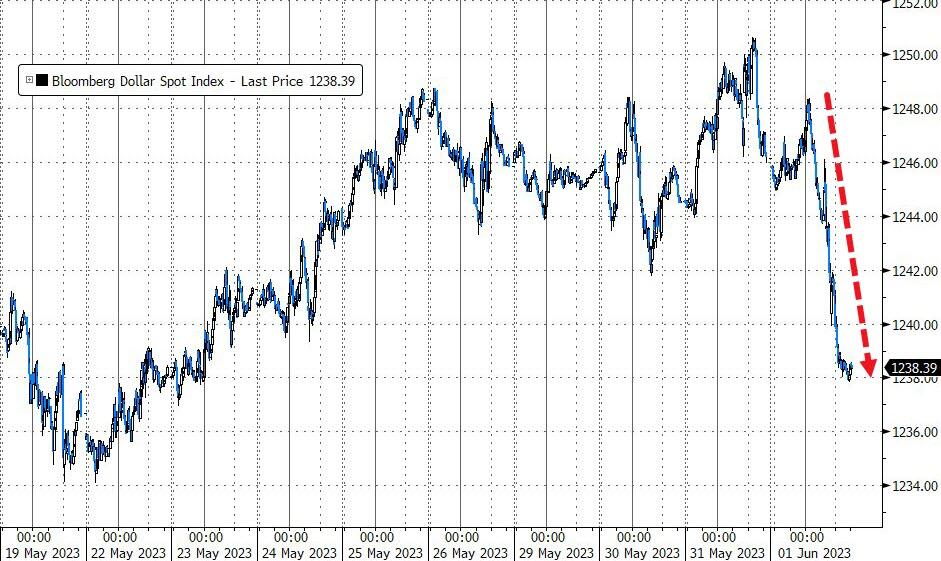
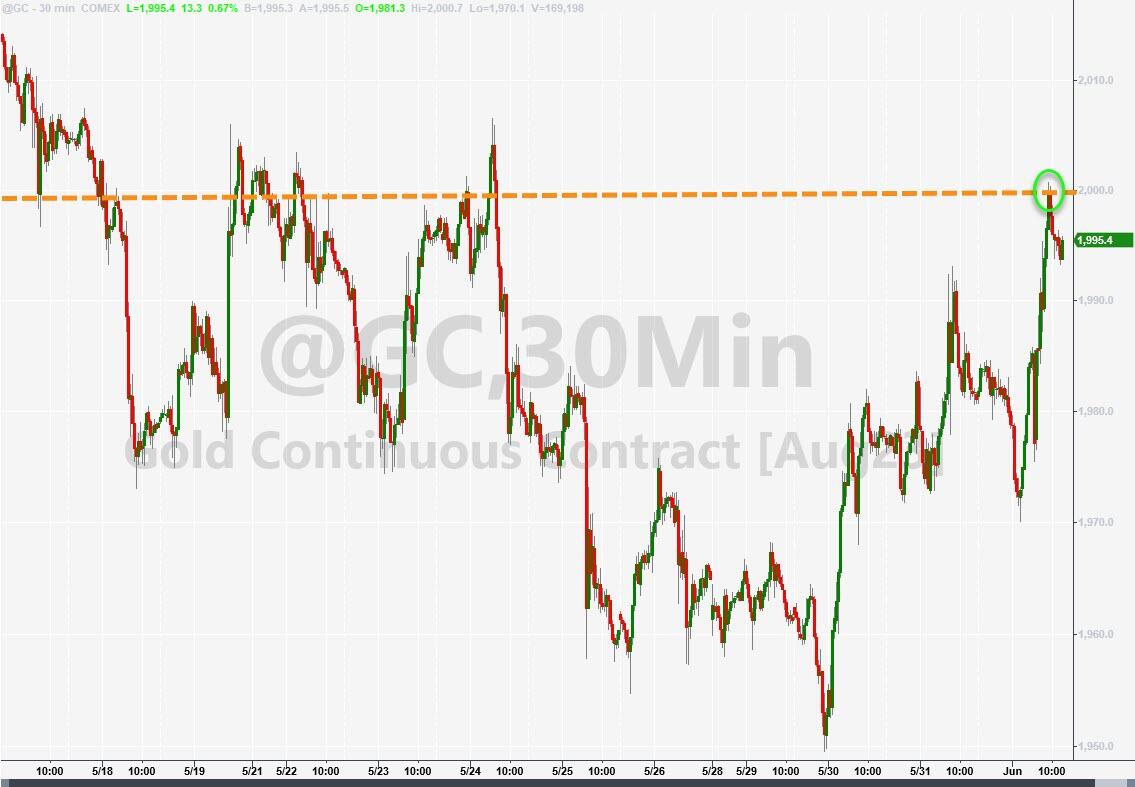
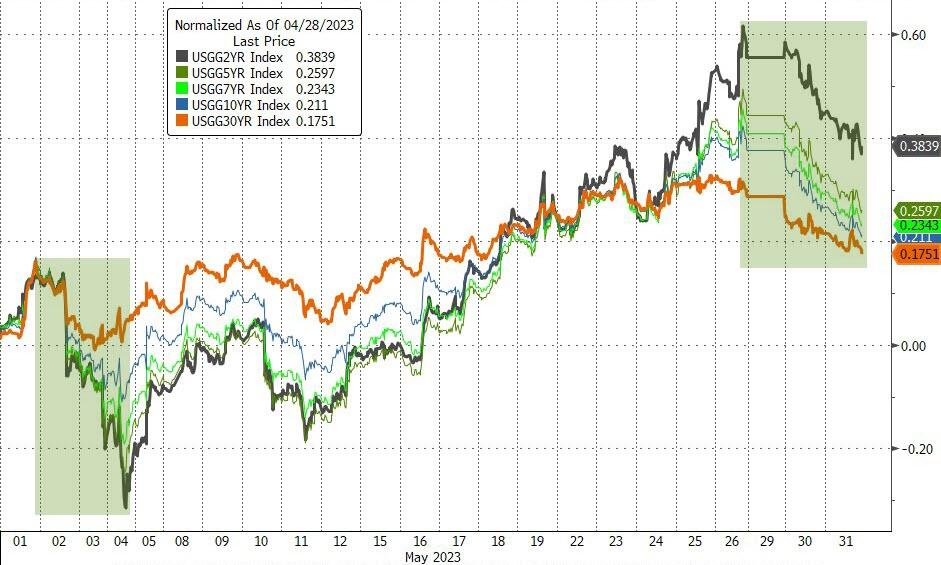
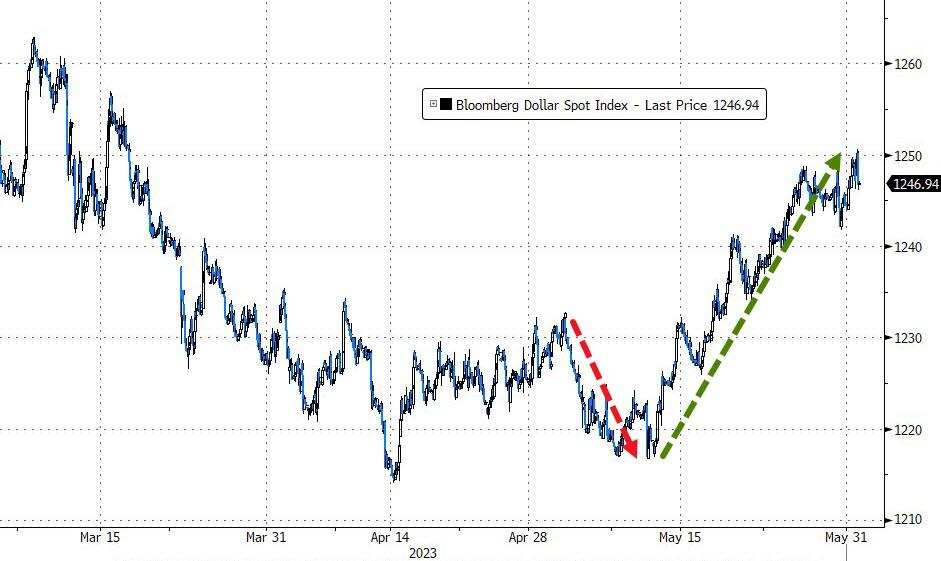
The bond market seemed to agree, as yields dropped sharply, and the 2-year note fell below 4.5% again. The dollar was flat, but gold shone brighter and moved closer to $2k.
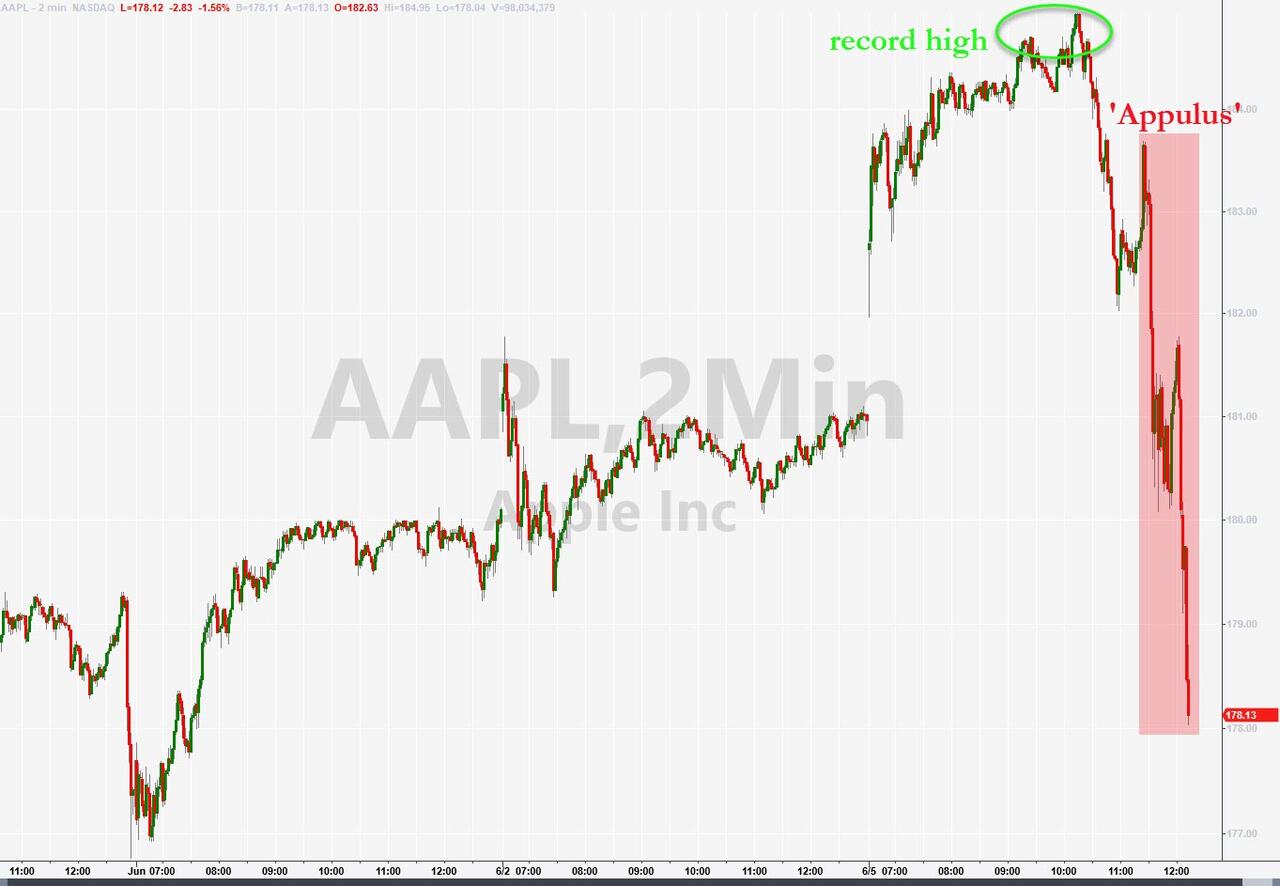
Apple briefly hit a new record high after announcing its futuristic VR/AR headset “Appulus”, which costs an arm and a leg and won’t be available until 2024. But investors quickly realized that they were buying a dream and sold off the stock, dragging the rest of the market with it.
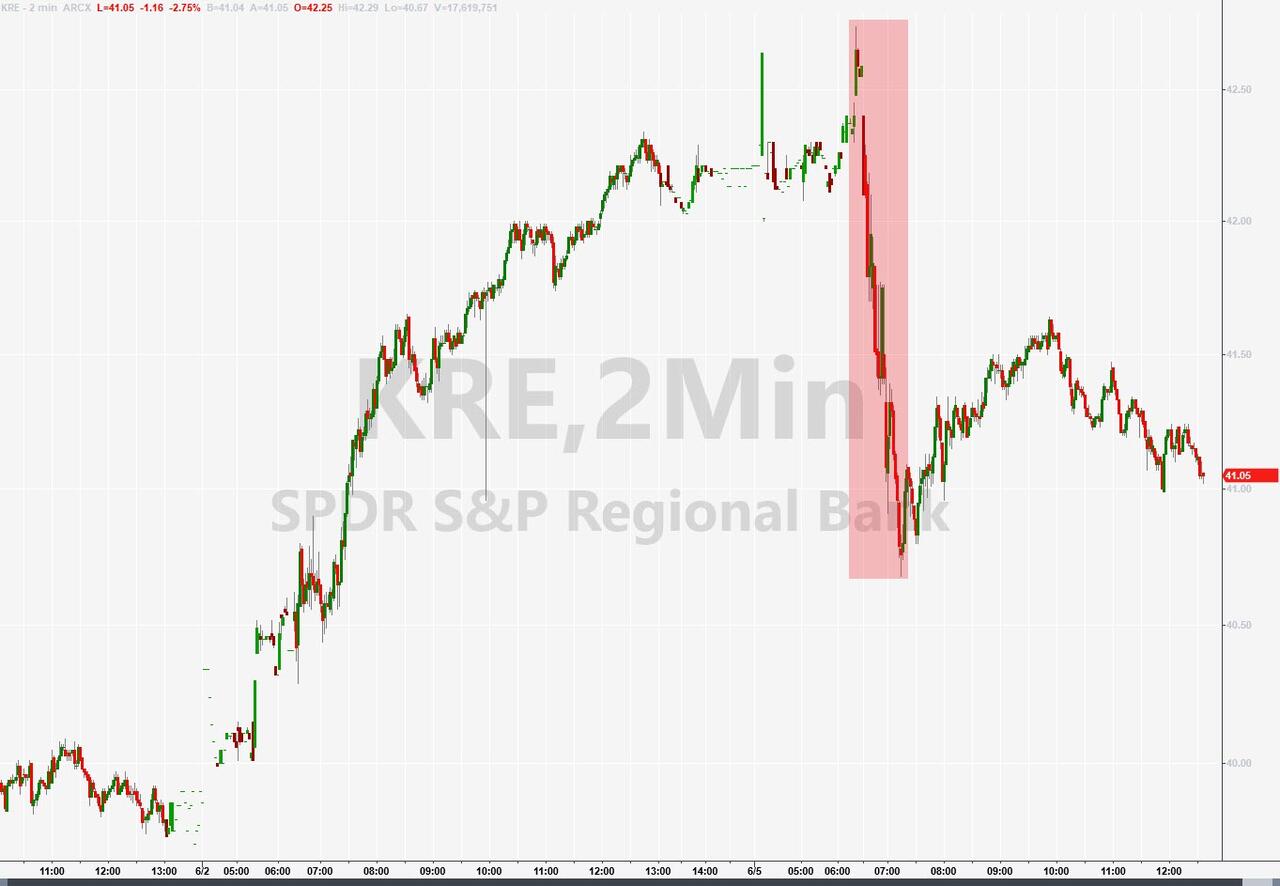
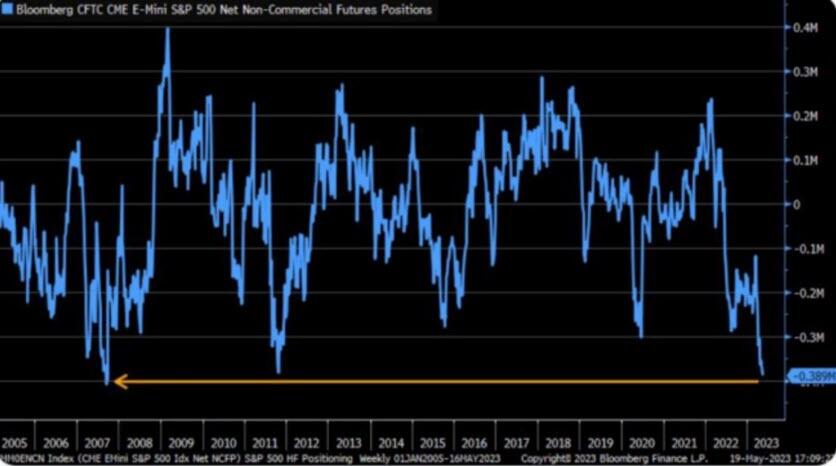
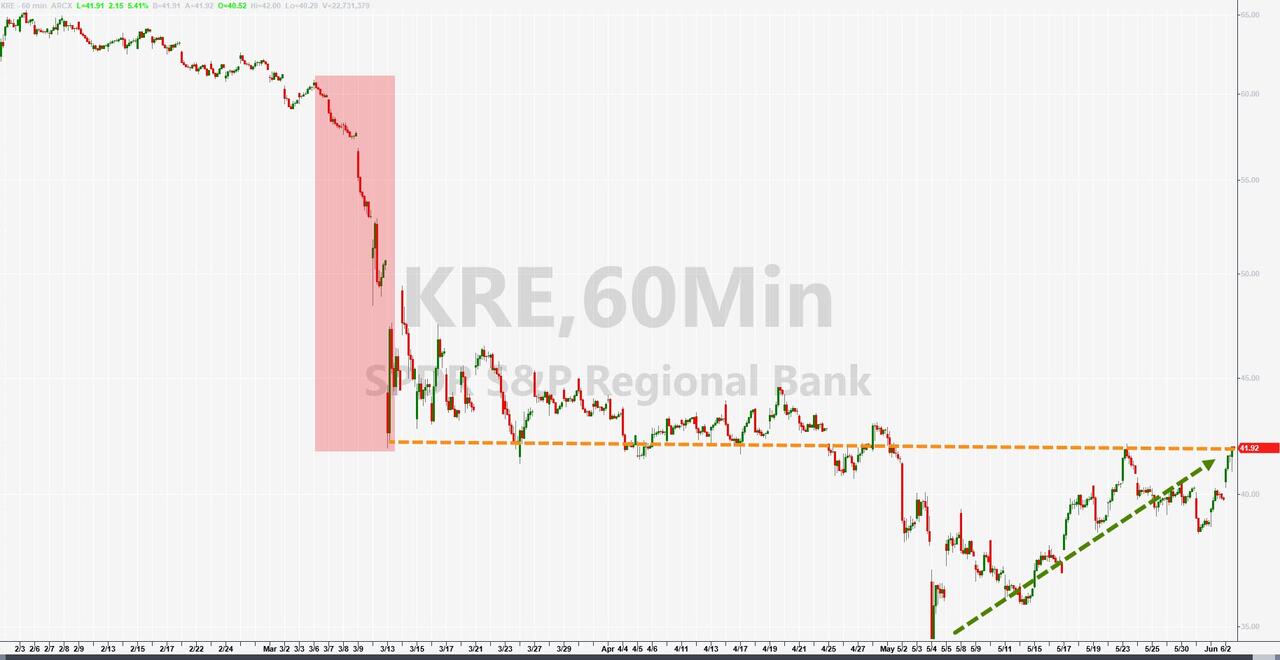
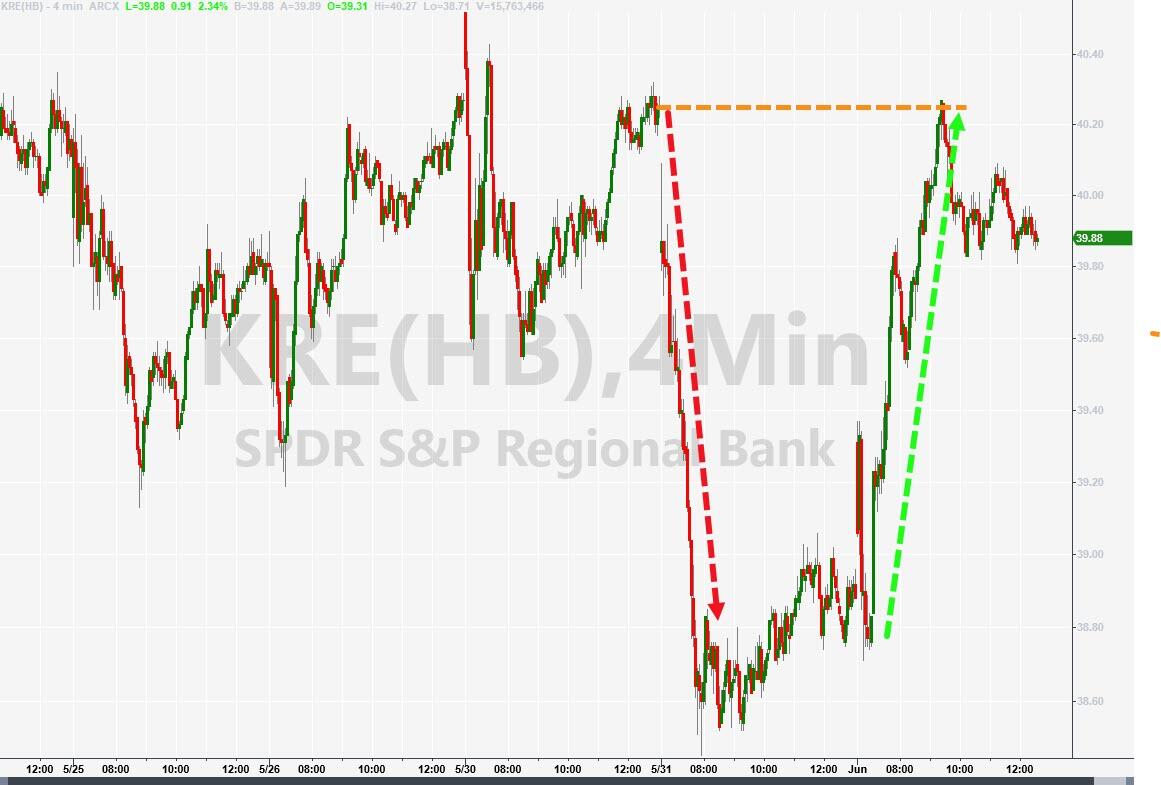
Bank stocks also suffered, especially the regional ones, as the index KRE took a dive. The big picture looked grim, as analyst Mathew Piepenburg pointed out that the S&P 500 futures market is now more bearish than ever since 2011 and almost as bad as late 2007.
We all know what happened next in 2008.
Read More
