
- Moving the markets
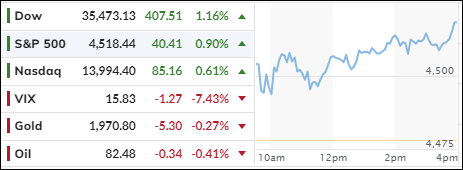
The Dow led the way in a bullish day for the stock market, while the Nasdaq trailed behind but managed to end its 4-day losing streak.
Tesla was one of the laggards, dropping 2% amid a tech sell-off. The rally was fueled by strong earnings reports, as 80% of the S&P 500 companies that have reported so far beat Wall Street’s lowered expectations.
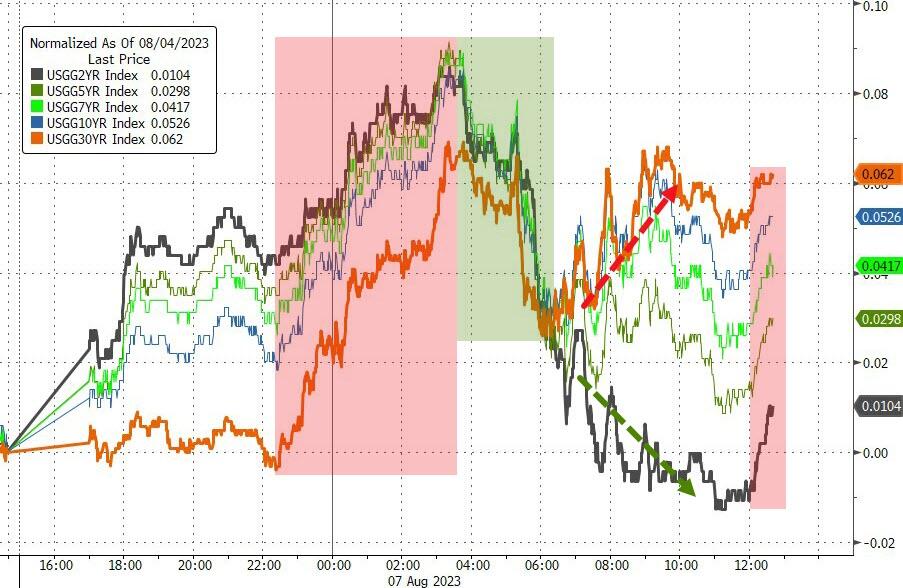
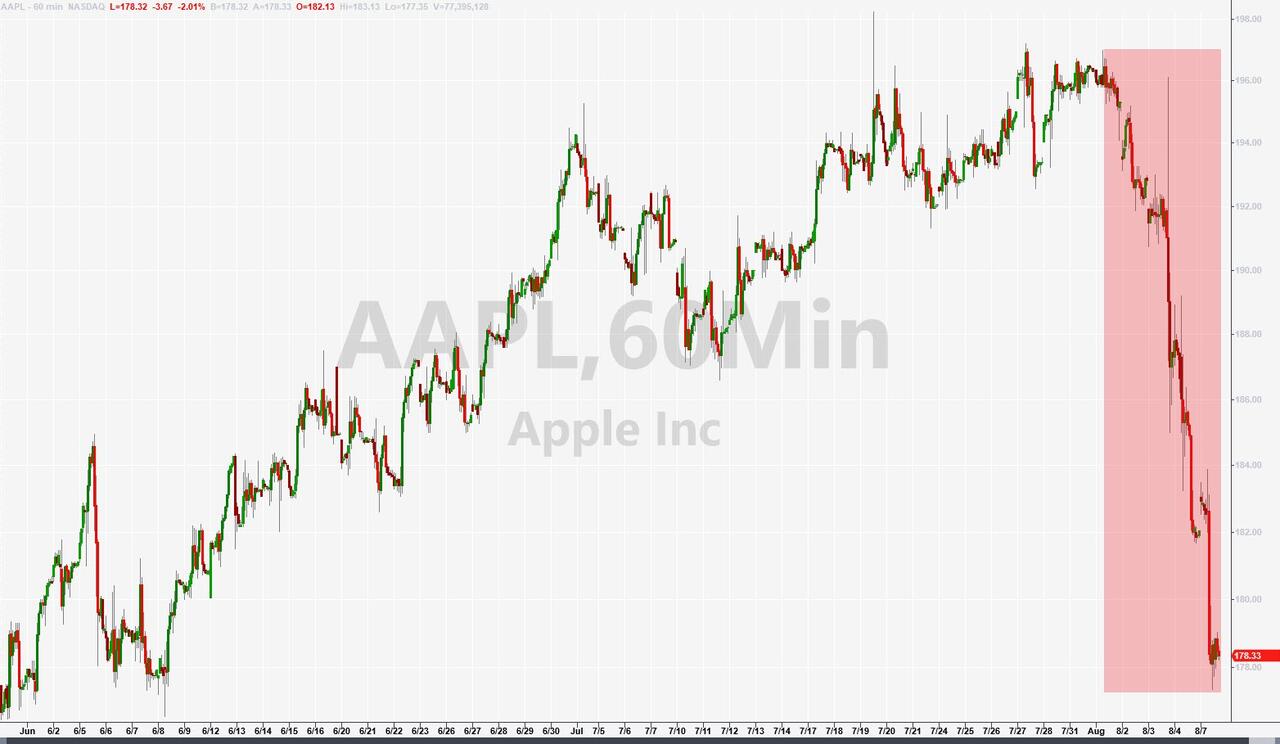
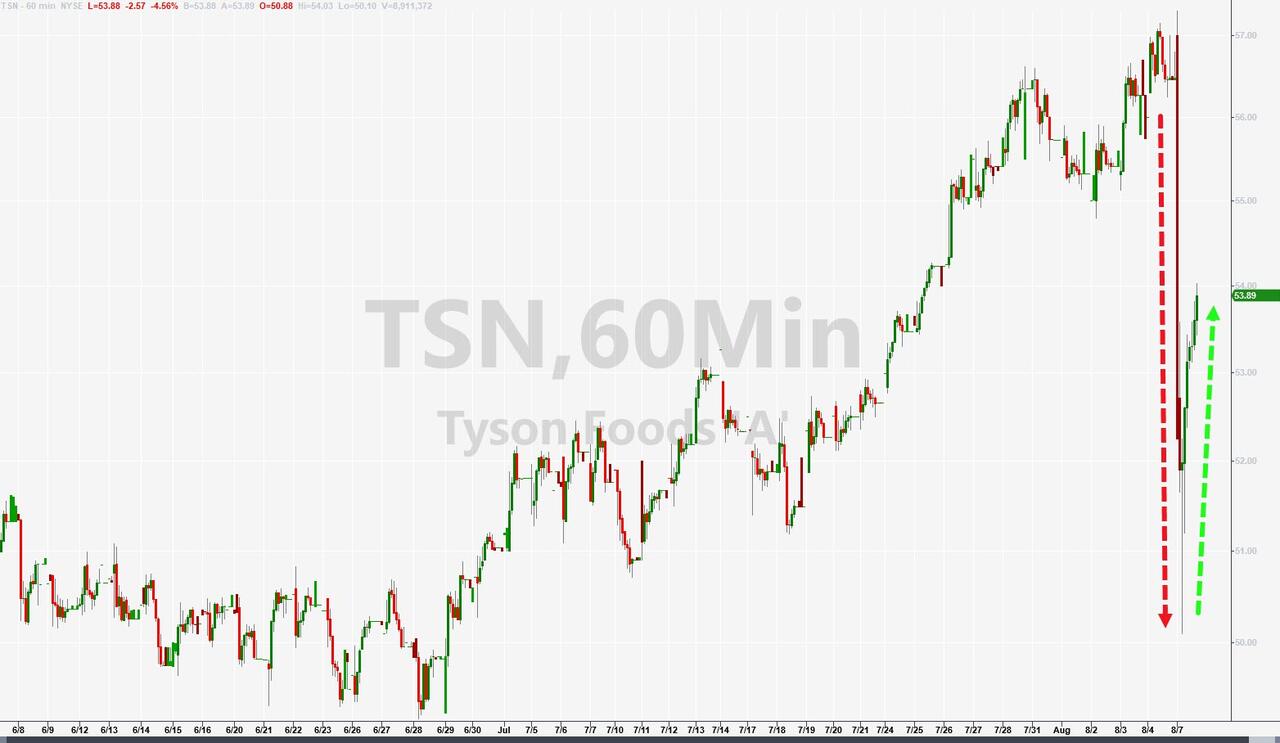
The market rebounded despite rising bond yields and Apple’s fifth consecutive day of losses, which shaved off 10% of its value since last week. This was its worst performance since November. Tyson Foods also had a rough day, but the market recovered some of its losses in the final hour thanks to bargain hunters.
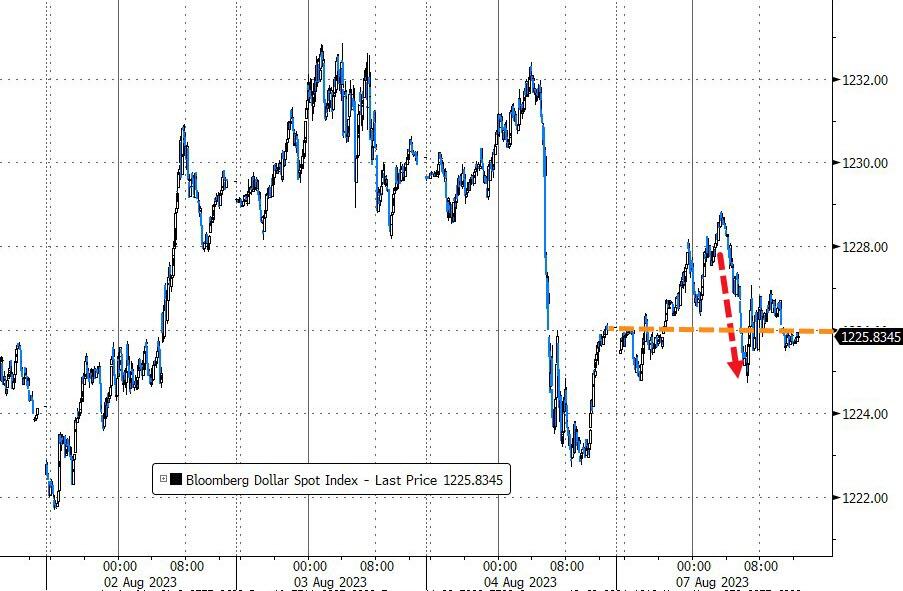
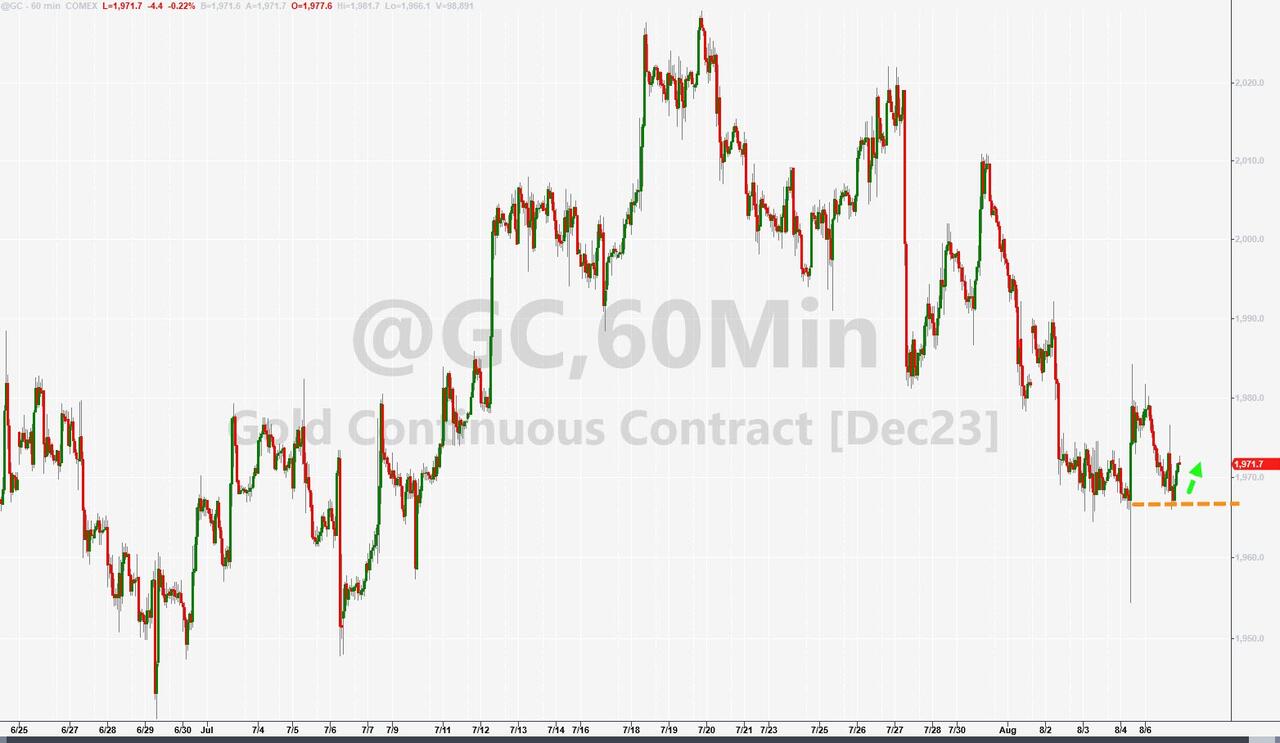
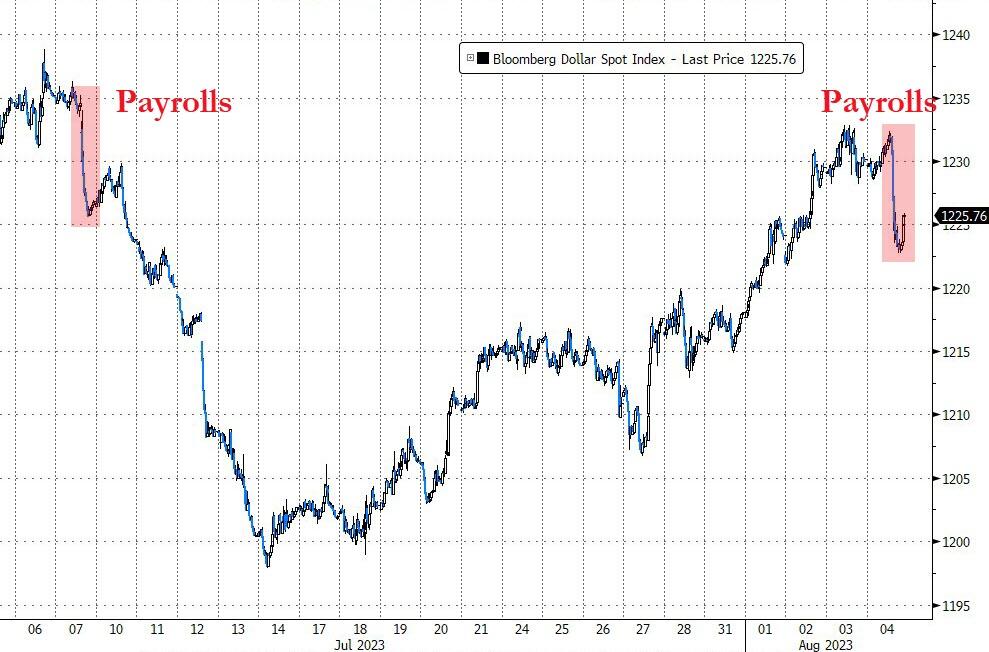
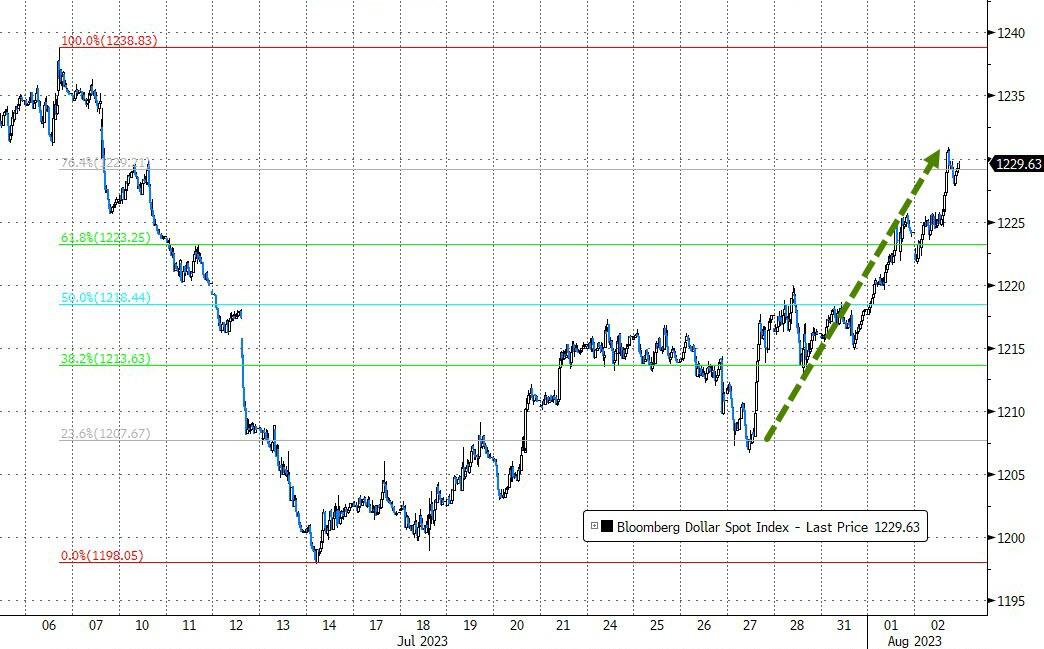
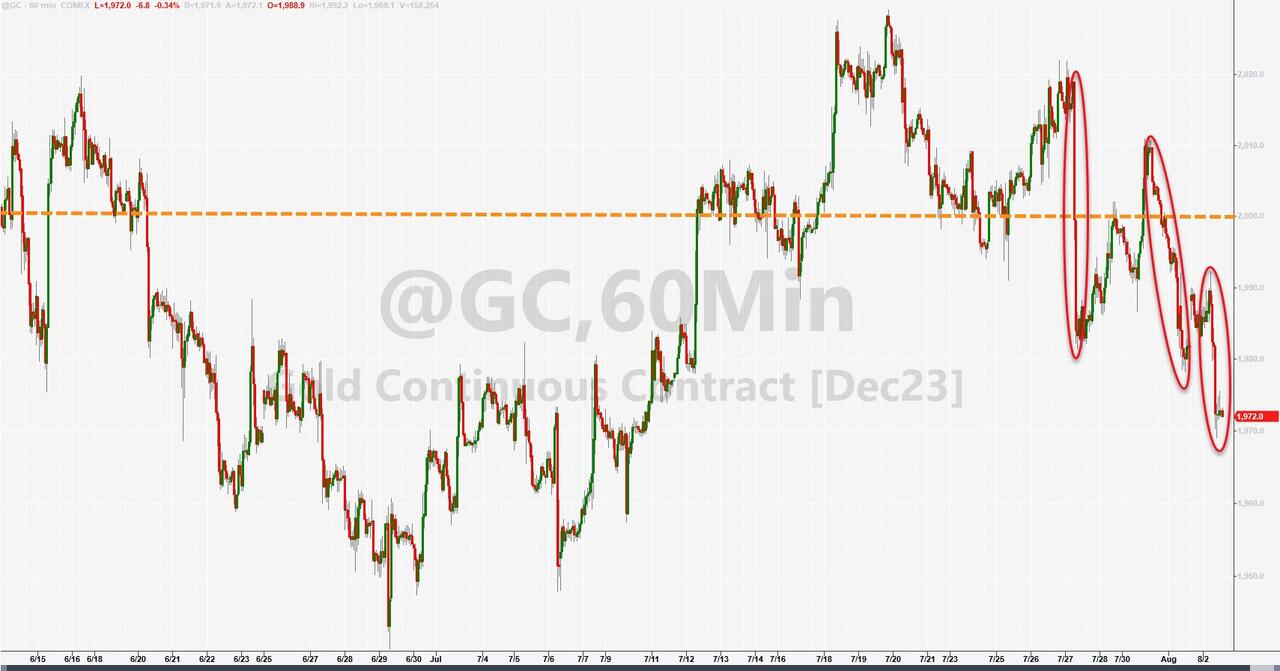
The dollar was flat, while gold dipped and then recovered but still closed in the red.
Later this week, investors will pay attention to the consumer and producer prices indexes, which are key indicators of inflation and economic health. Both could move the market significantly depending on their outcomes.
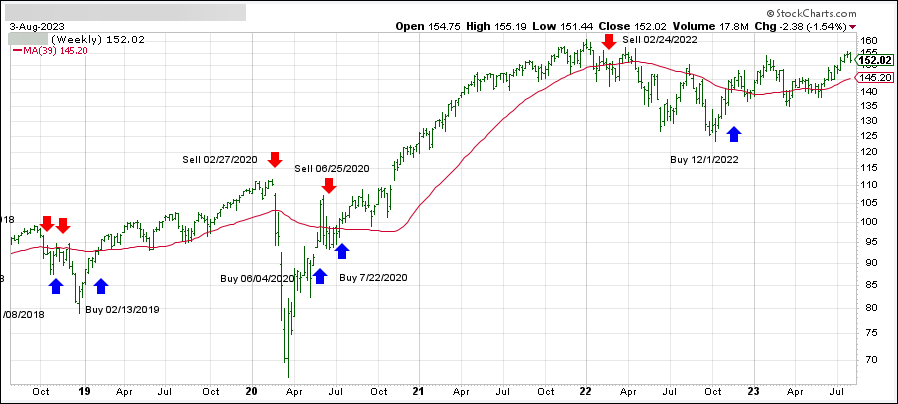
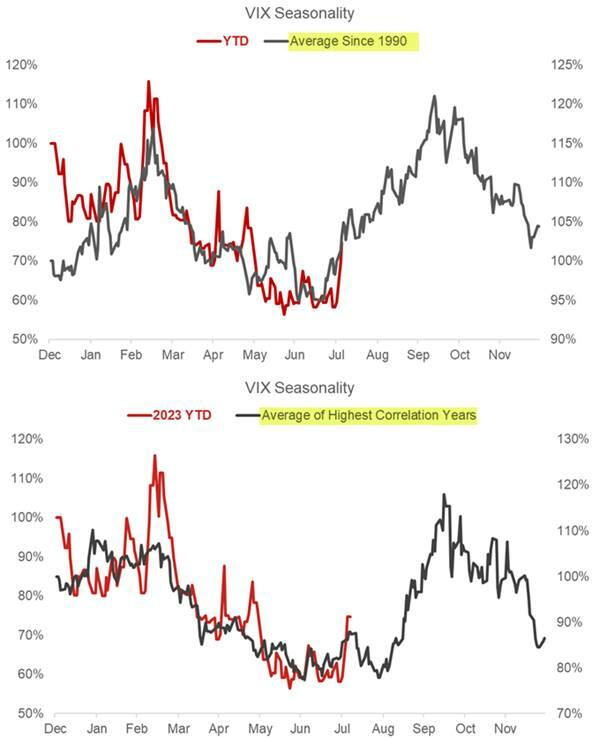
In the meantime, traders should be aware of the seasonal pattern of the volatility index (VIX), which tends to spike in August. This chart shows how this could spell trouble for stocks, as higher volatility usually means lower prices.
Remember, when the VIX goes up, stocks go down.
Read More

