ETF Data updated through Thursday, October 5, 2023
How to use this StatSheet:
Out of the 1,800+ ETFs out there, I only pick the ones that trade over $5 million per day (HV ETFs), so you don’t get stuck with a lemon that nobody wants to buy or sell.
Trend Tracking Indexes (TTIs)
These are the main indicators that tell you when to buy or sell Domestic and International ETFs (section 1 and 2). They do that by comparing their position to their long-term M/A (Moving Average). If they cross above, and stay there, it’s a green light to buy. If they fall below, and keep going, it’s a red light to sell. And to make sure you don’t lose your shirt if things go south, I also use a 12% trailing stop loss on all positions in these categories.
All other investment areas don’t have a TTI and should be traded based on the position of each ETF relative to its own trend line (%M/A). That’s why I call them “Selective Buy.” In other words, if an ETF goes above its own trend line, you can buy it. But don’t forget to use a trailing sell stop of 12%, or less if you’re feeling nervous.
If some of these words sound like Greek to you, please check out the Glossary of Terms and new subscriber information in section 9.
DOMESTIC EQUITY ETFs: SELL— since 09/22/2023
Click on chart to enlarge
This is our main compass, the Domestic Trend Tracking Index (TTI-green line in the above chart). It has now broken below its long-term trend line (red) by -4.59% and has moved into “Sell” mode effectively 9/22/2023.
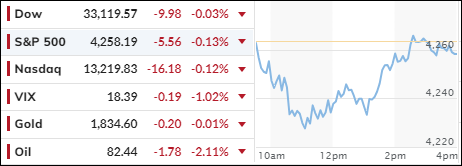
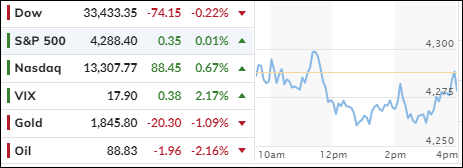
The major indexes tiptoed on Thursday, waiting for the big reveal of the jobs data on Friday that could make or break interest rate policy.
Weekly initial jobless claims were 207,000 for the week ending Sept. 30, a measly 2,000 more than the previous week. Economists had predicted 210,000. The tiny bump in jobless claims was no surprise to the Street, but it dashed the hopes of some investors who wanted to see some signs of a labor market meltdown and a stop to the rising rates that are killing the stocks.
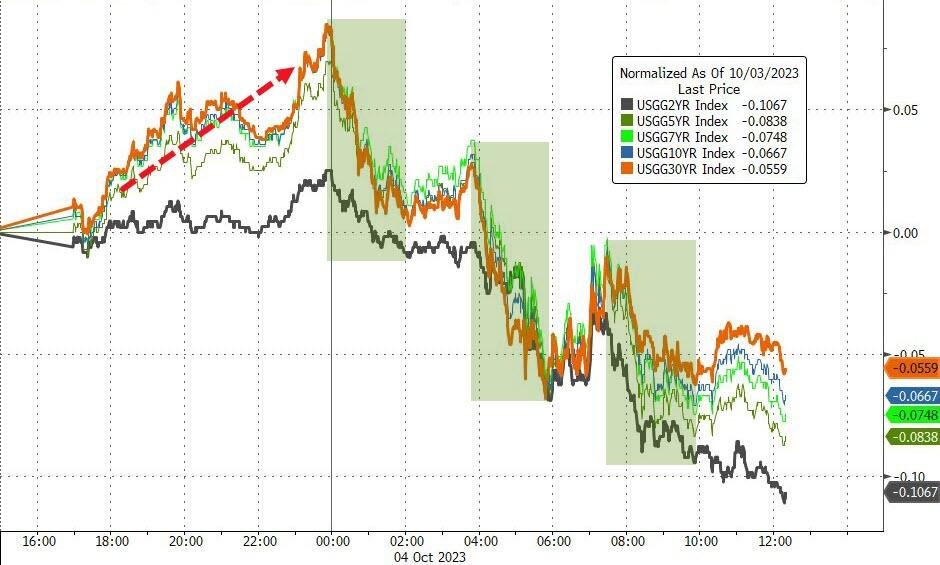
The 10-year Treasury yield jumped a bit after the jobless claims report before crawling back down. It ended the day at 4.713% and stayed flat during the session.
On Friday, economists expect non-farm payrolls for September to show a 170,000 increase, down from a 187,000 boost in August. Investors are not rooting for a recession, but they are crossing their fingers for some labor market slack that would make the Federal Reserve think twice about hiking rates again and put an end to the soaring Treasury yields that hit 16-year highs.
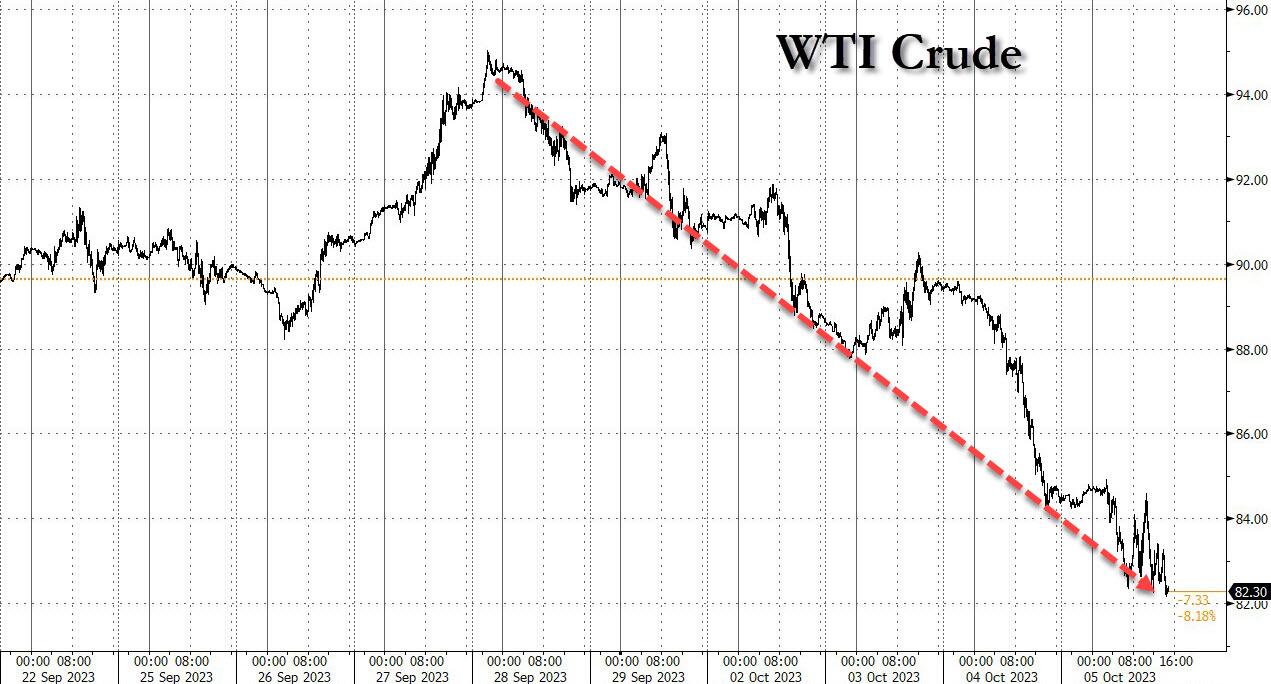
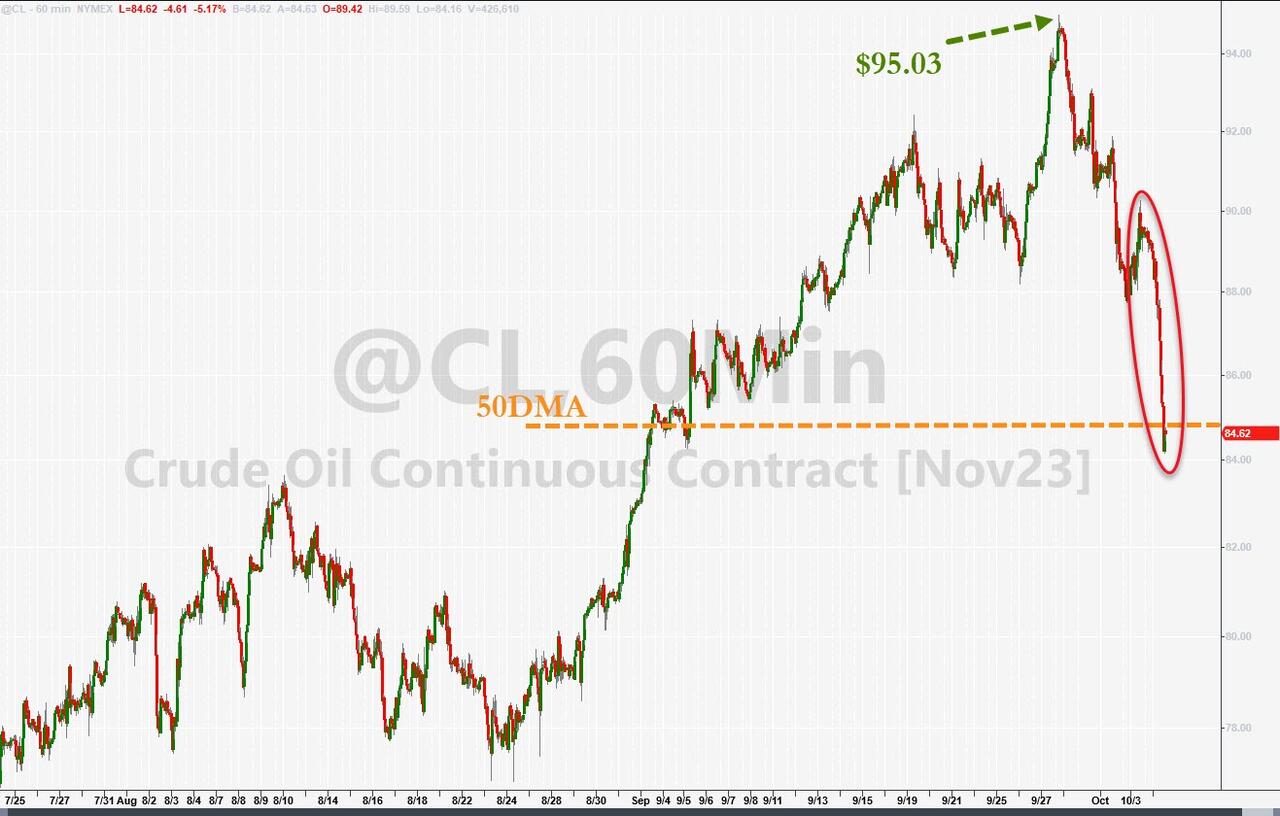
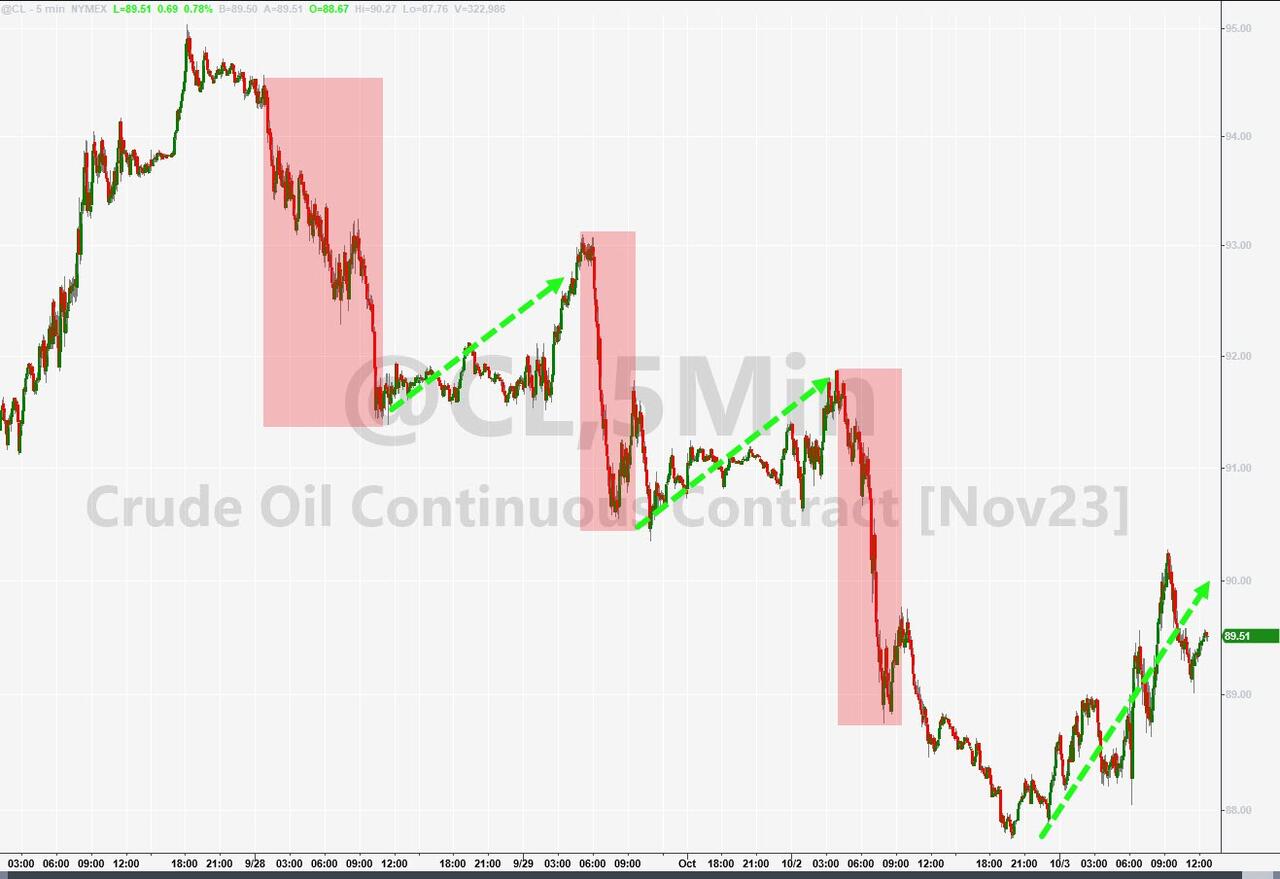
The crude oil moves in the past week have been a circus act, with WTI soaring above $95 last Thursday only to nosedive to $82 today, after tumbling by more than 5% yesterday, the biggest one day drop since last September’s panic attack. There are a few explanations for why oil has tanked so hard, such as weak demand, crowded bets on oil, and geopolitical worries. But who really knows…
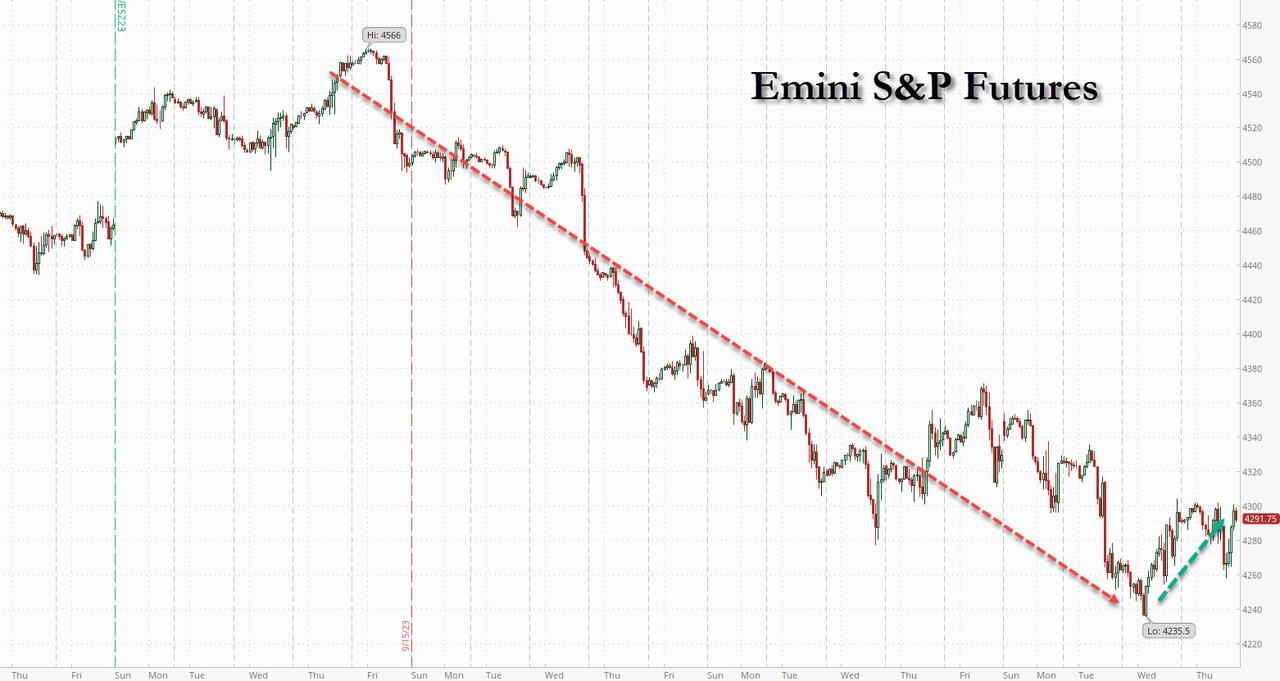
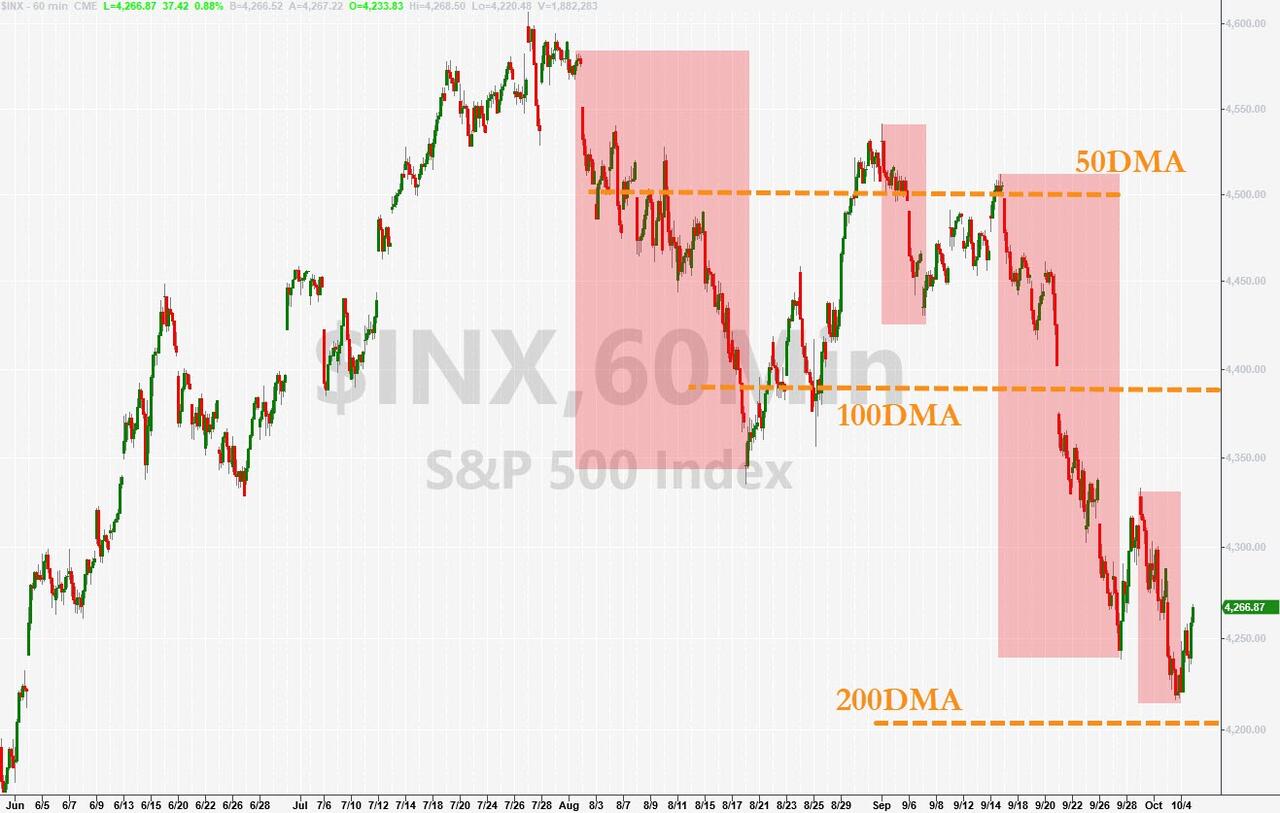
The S&P 500 had a wild ride today, but in the end barely moved from yesterday’s turnaround. Still, the index has some work to do before getting back on track with a bullish trend.
That said, unless we see a huge flop in the jobs report and a plunge tomorrow, it’s hard to imagine how stocks will manage to lift the S&P by 0.7% on Friday and erase what is likely to be another weekly loss for stocks, the fifth in a row, and the longest such streak since May 2022.
Will the payroll report save or sink the market tomorrow? Stay tuned…
Continue reading…
2. “Buy” Cycle (12/1/22 to 9/21/2023)
The current Domestic Buy cycle began on December 1, 2022, and concluded on September 21, 2023, at which time we liquidated our holdings in “broadly diversified domestic ETFs and mutual funds”.
Our International TTI has now dipped firmly below its long-term trend line, thereby signaling the end of its current Buy cycle effective 10/3/23.
We have kept some selected sector funds. To make informed investment decisions based on your risk tolerance, you can refer to my Thursday StatSheet and Saturday’s “ETFs on the Cutline” report.
Considering the current turbulent times, it is prudent for conservative investors to remain in money market funds—not bond funds—on the sidelines.
3. Trend Tracking Indexes (TTIs)
The major indexes fluctuated throughout the day and closed with a slight loss.
Our Trend Tracking Indexes (TTIs) showed mixed results, with the Domestic TTI declining and the International TTI rising slightly. These trends did not change our bearish outlook on the market.
This is how we closed 10/5/2023:
Domestic TTI: -4.59% below its M/A (prior close –4.32%)—Sell signal effective 9/22/2023.
International TTI: -2.54% below its M/A (prior close -2.88%)—Sell signal effective 10/3/2023.
All linked charts above are courtesy of Bloomberg via ZeroHedge.
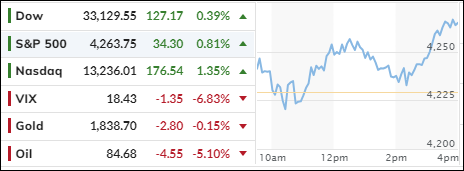
The S&P 500 had a rare, good day on Wednesday, as investors breathed a sigh of relief when Treasury yields retreated from their highest levels since 2007.
The catalyst was a disappointing jobs report that showed the labor market was not as hot as expected. But don’t get too excited because this could be just a temporary bounce in a downtrend.
The market is still under pressure from rising interest rates, slowing economic growth, and geopolitical risks. Unless rates come down without triggering a financial meltdown or a recession, the bulls will have a hard time finding buyers.
The jobs report revealed that only 89,000 private payrolls were added in September, far below the forecast of 160,000 and the revised 180,000 in August. This sent the 10-year Treasury yield down to 4.732%, after it had crossed the 4.8% threshold on Tuesday.
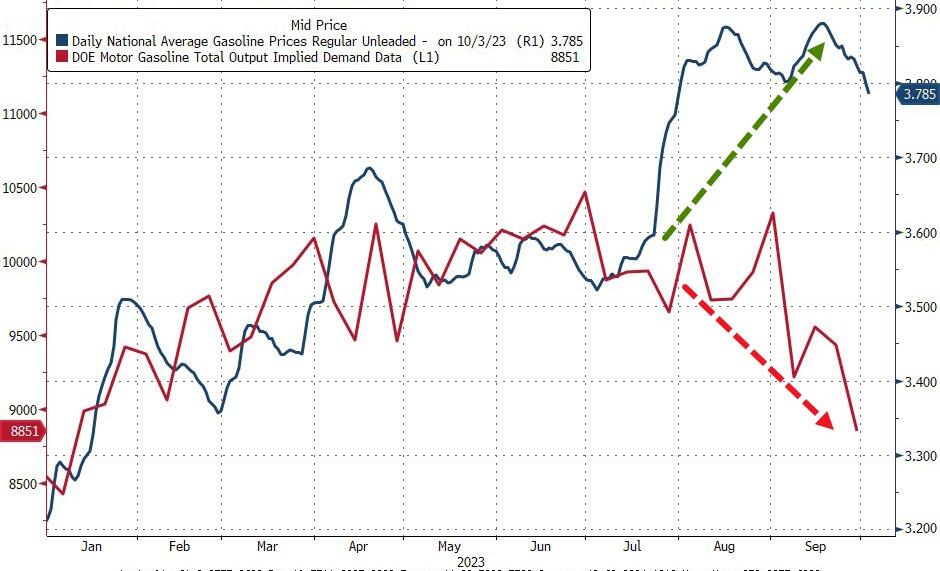
The consumer discretionary sector was the star of the day, gaining more than 1%. The energy sector was the loser, as oil prices dropped below $85 per barrel. The high gas prices seem to have taken a toll on consumer spending, as gasoline demand plunged to its lowest level for this time of year since 1997.
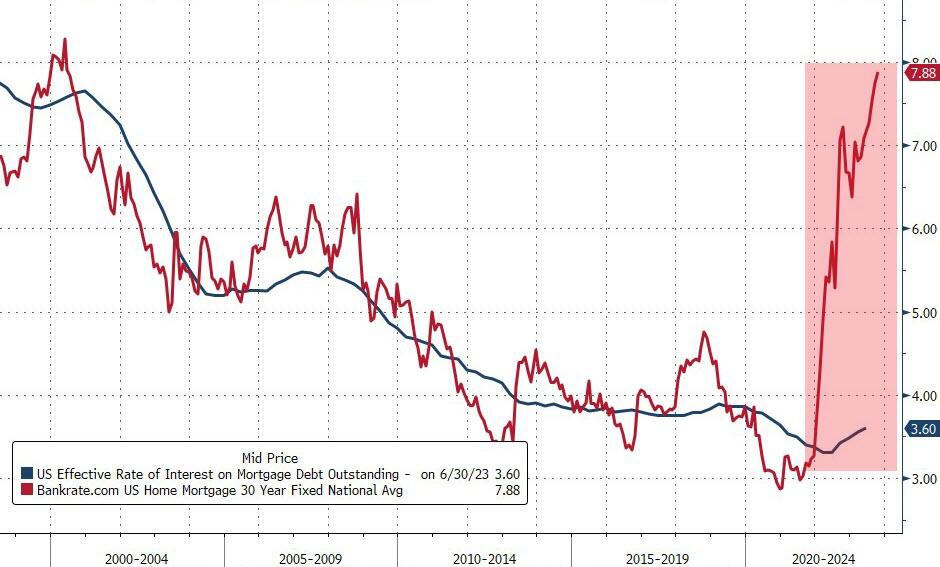
Higher interest rates have also hurt the housing market, as mortgage rates climbed near 8%. As a result, mortgage demand fell to its lowest level since 1996. That’s gotta hurt!
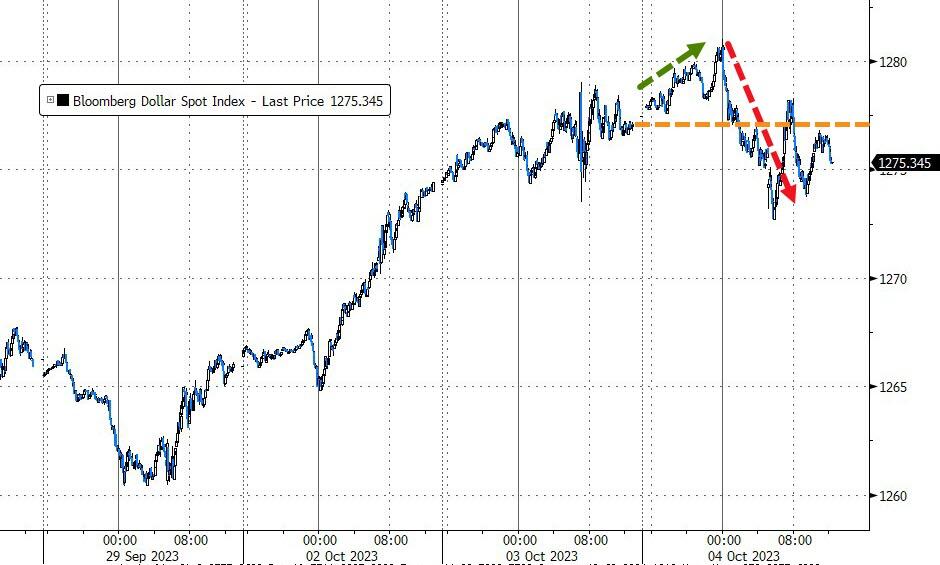
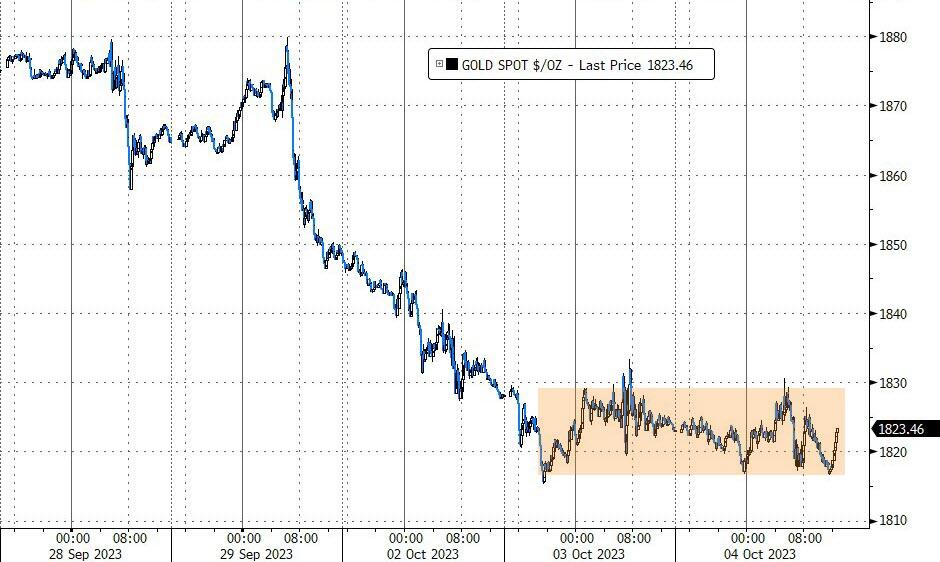
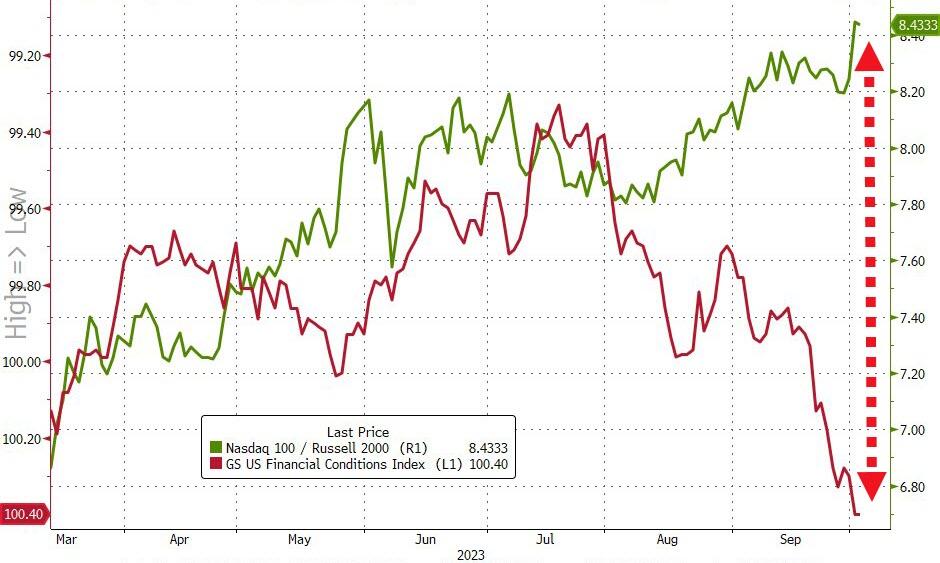
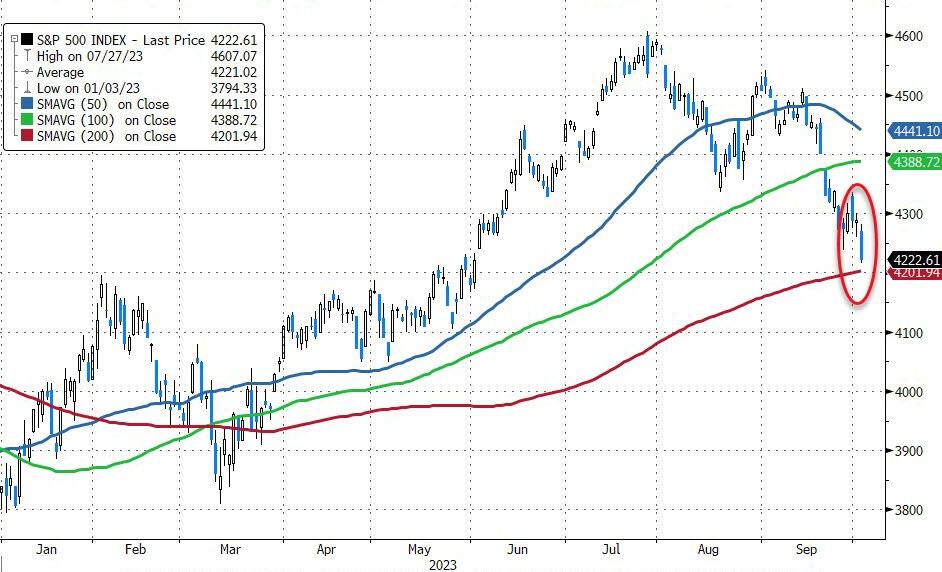
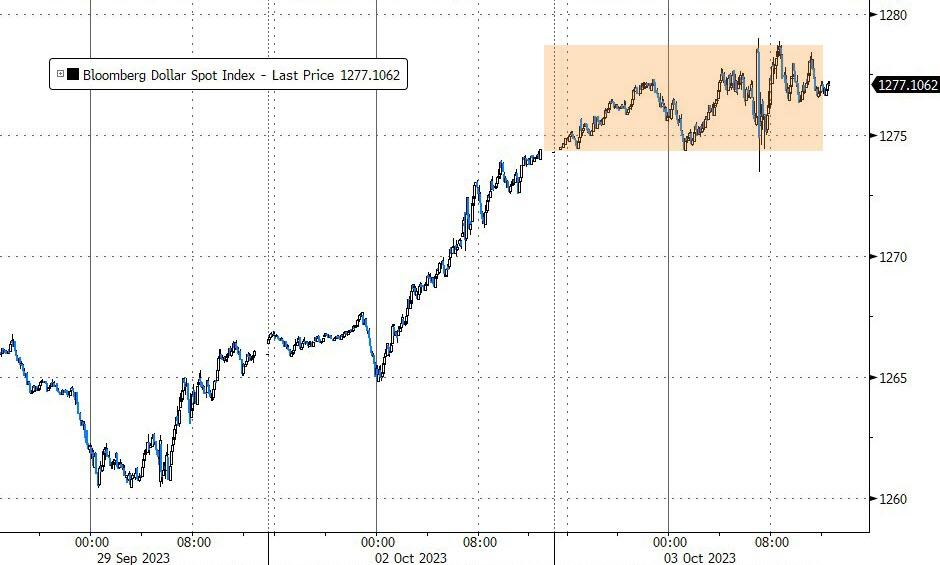
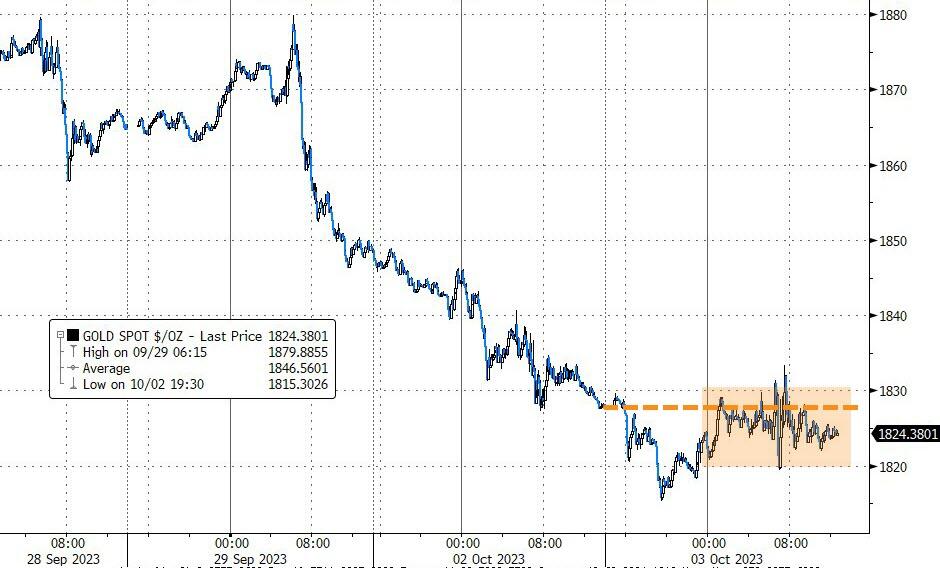
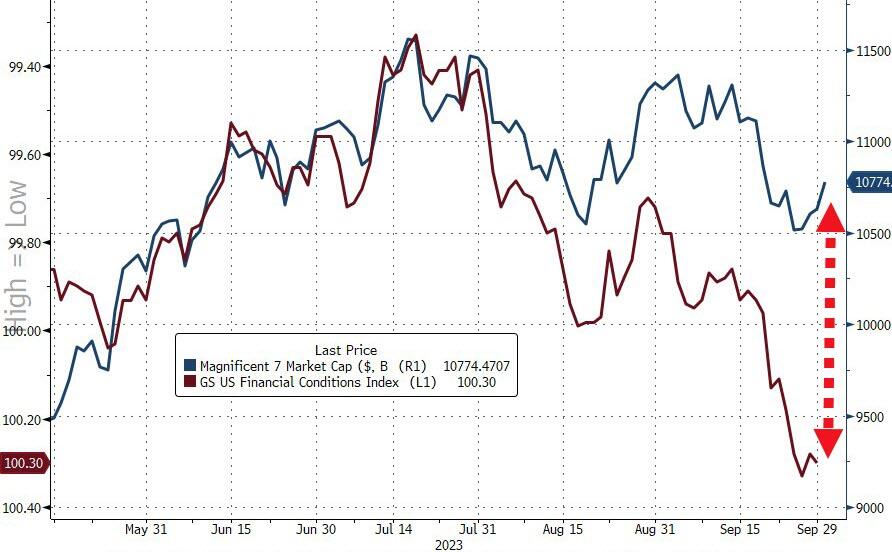
The S&P 500 has been making lower lows on 33 of the past 50 trading days, the dollar has barely moved, gold has been flat, and financial conditions have been tight.
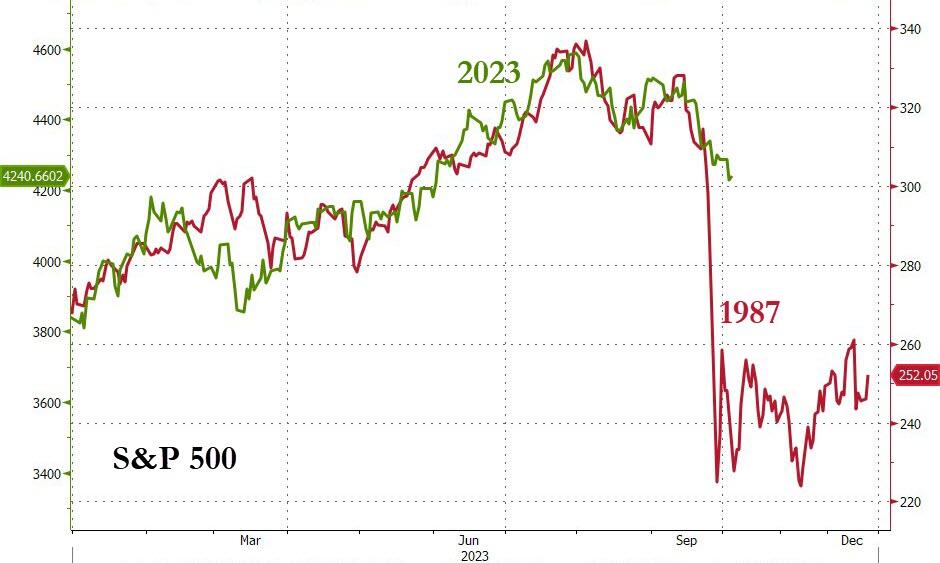
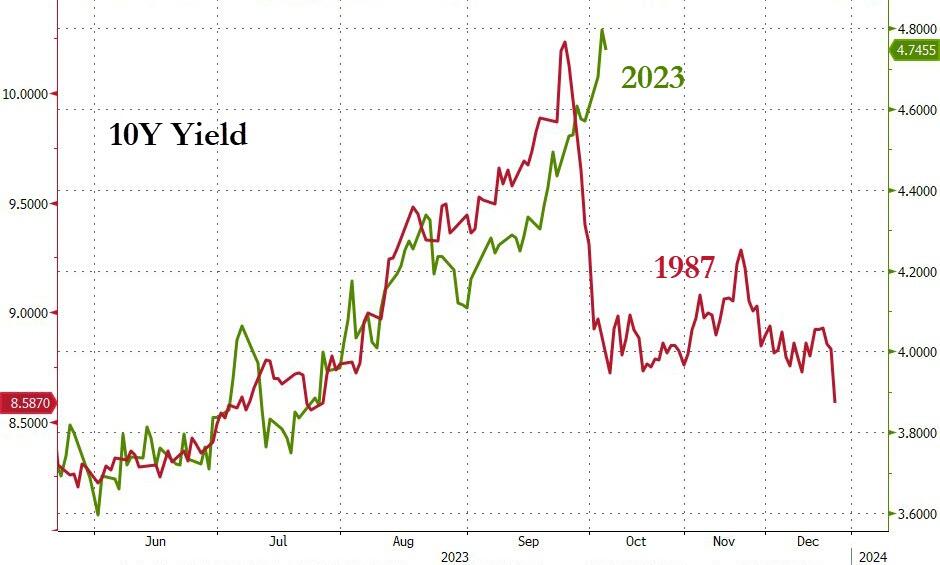
Some analysts have compared the current situation to historical events, such as the ZeroHedge charts that show the similarity between the S&P 500 and the 10-year yield now and in 1987.
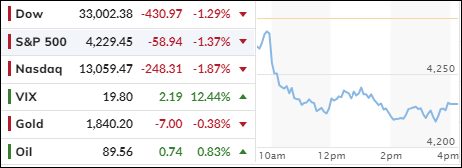
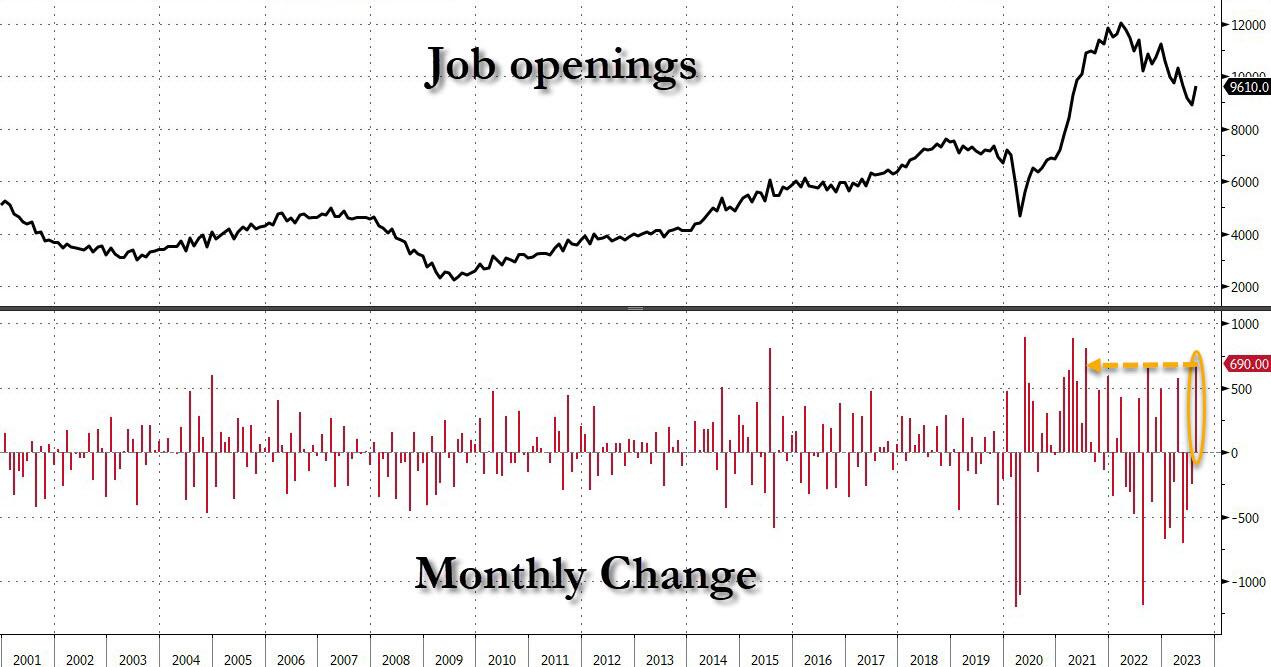
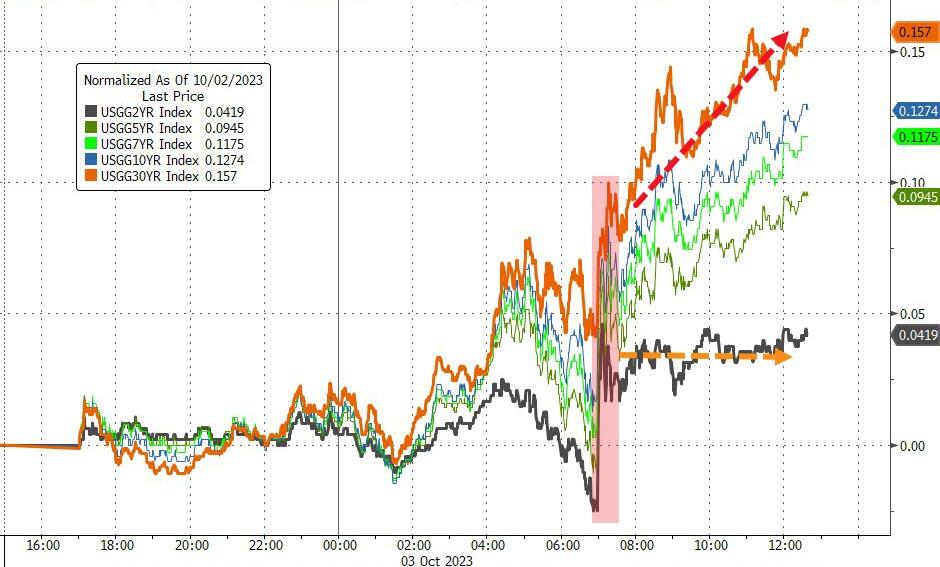
The stock market plunged today as bond yields soared to new highs. The trigger was the August job openings report, which showed a record-breaking 9.61 million vacancies in the U.S. economy. That’s a whopping 690,000 more than the previous month, and the largest jump since July 2020.
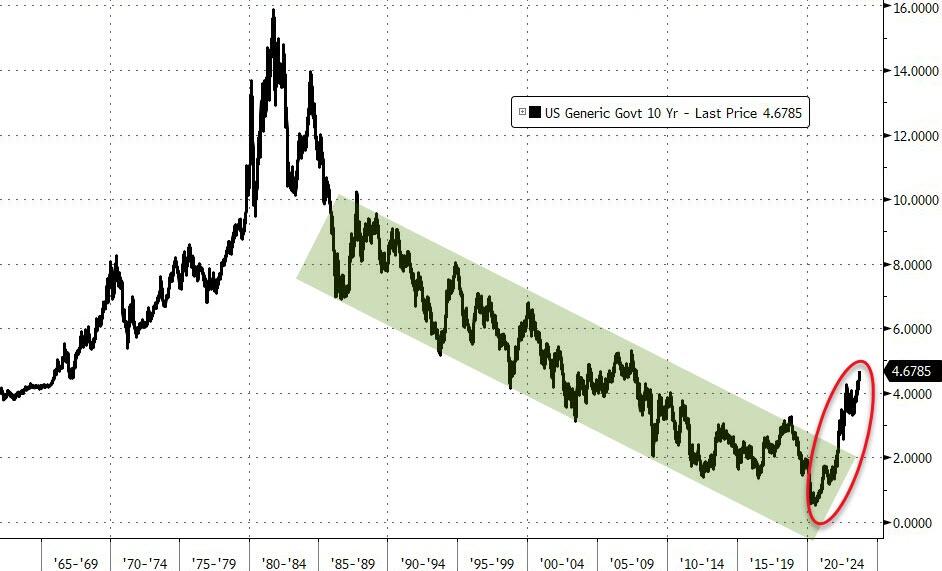
The 10-year Treasury yield settled at 4.80%, slightly below its peak of 4.81% in the morning, which was the highest level since 2007. Investors are finally waking up to the reality that the Fed is and has been serious about tightening monetary policy for a long time. I have been warning about this all year, while the Wall Street pundits were in denial.
High yields are bad news for stocks, especially as financial conditions get tighter and tighter. CNBC’s Rick Santelli added fuel to the fire by predicting that the 10-year yield could reach 13% or 14% in the next seven years. He blamed the runaway government spending and the looming $2 trillion deficit for triggering inflation and bond vigilantes.
He has a point, but his doom-and-gloom scenario did not go down well with the equity bulls, who sold off their shares in panic. The only silver lining is that we, as Trend Followers, have been out of this mess since our domestic TTI signaled a “Sell” on 9/22/2023.
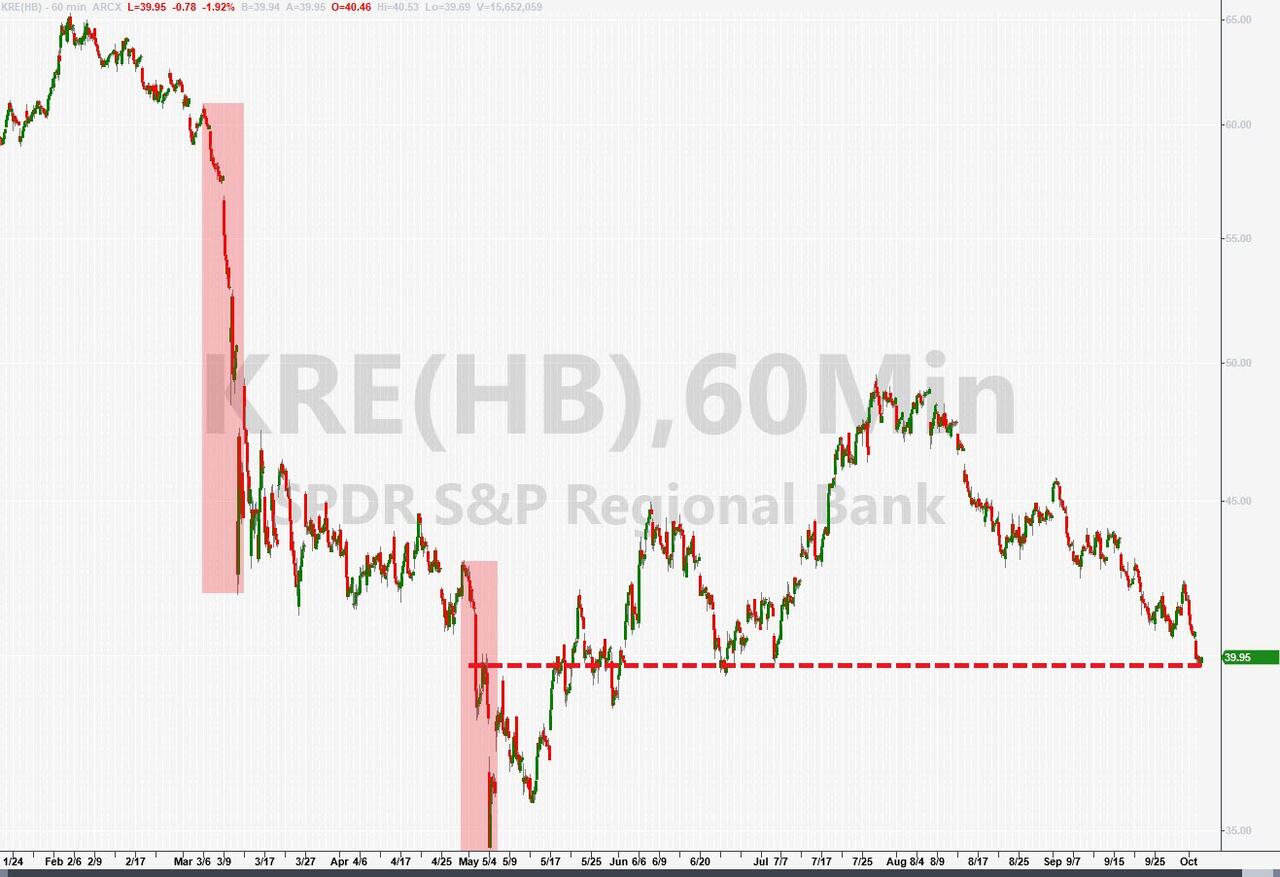
Things could get even uglier if the S&P 500 breaks below its 200-day moving average, which is not far away. Banks (KRE) are also suffering, as higher yields expose their balance sheet problems.
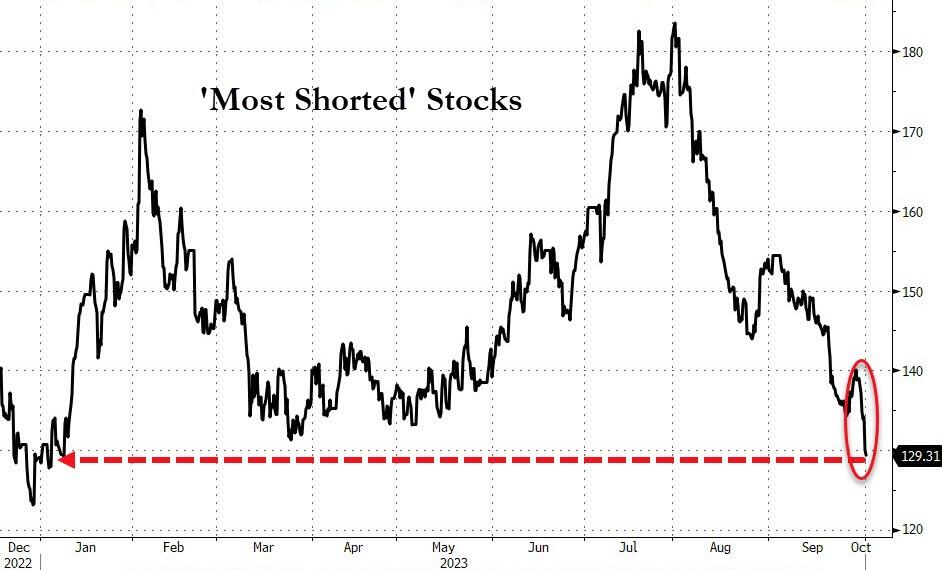
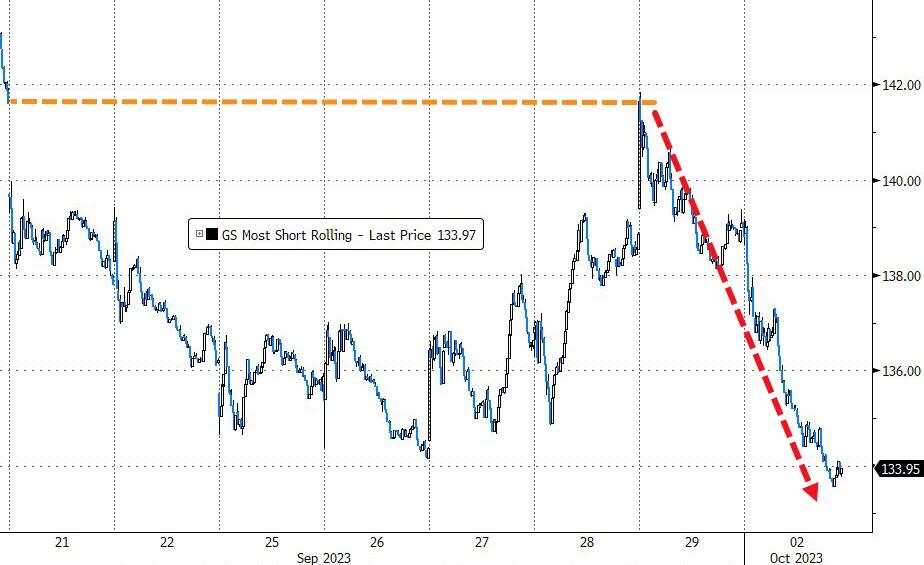
Interestingly, the one thing that used to prop up the market most of the year – short squeezes – is no longer working. The most shorted stocks are now in negative territory for the year.
QTR’s Fringe had a nice take on the current uncertainty:
There is no way that an “everything bubble” inflated by years of zero interest rates and trillions of dollars of global “quantitative easing” can survive when faced with 5%+ rates and $95 billion/month of U.S. “quantitative tightening” plus less money from other central banks.
Contrary to what equity bulls think, bubbles don’t pop softly, and when they do, it takes a long time for lower inflation and lower rates to help stock prices. When the 2000 bubble popped and the Nasdaq crashed by 83% and the S&P 500 by 50%, inflation rates were only 3.4% in 2000, 2.8% in 2001 and 1.6% in 2002, and the Fed was cutting rates almost non-stop.
The stock market was in a bad mood on Monday, even though the politicians managed to avoid a government shutdown at the last minute.
The market ended the day flat, like a pancake. The small-cap stocks were especially unhappy, as the Russell 2000 index dropped 1.7% and turned red for the year. This was the first time the index lost money in 2023, showing that small is not always beautiful.
The Senate passed a bill to keep the government running until mid-November, just before the clock struck midnight on Saturday. President Biden signed it into law, and then probably went to bed. The lawmakers now have more time to figure out how to spend our money.
The market usually doesn’t care much about government shutdowns because they don’t affect the S&P 500 much. The average change for the index during a shutdown is zero, which is also the number of people who like shutdowns.
The Fed’s top watchdog, Michael Barr, said on Monday that interest rates will stay high for a long time. He said we should focus more on how long they will be high, rather than if they will go up one more time this year. The market got the message and shifted its expectations from dovish to hawkish.
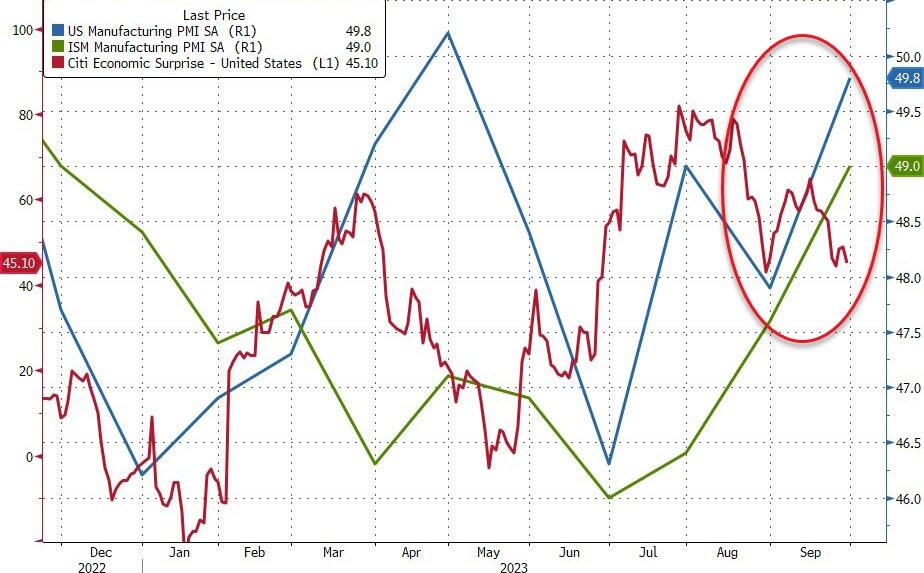
The Manufacturing PMI report showed that inflation was heating up faster than a microwave, and the Fed speakers confirmed that they were not going to cool it down anytime soon. Fed Governor Michelle Bowman said that they may need to raise rates several times to bring inflation back to 2%. She said she still expects more rate hikes in the future, which is like saying she expects more pain in the future.
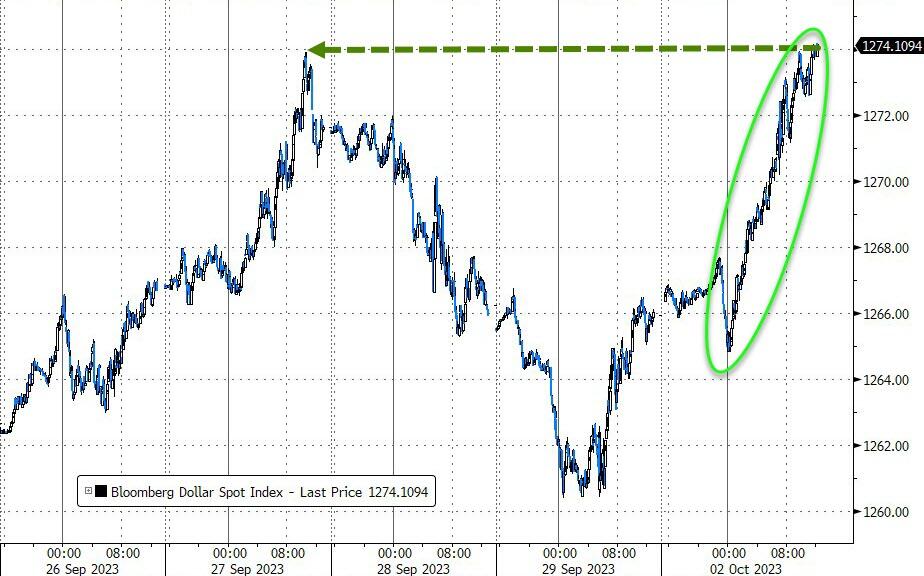
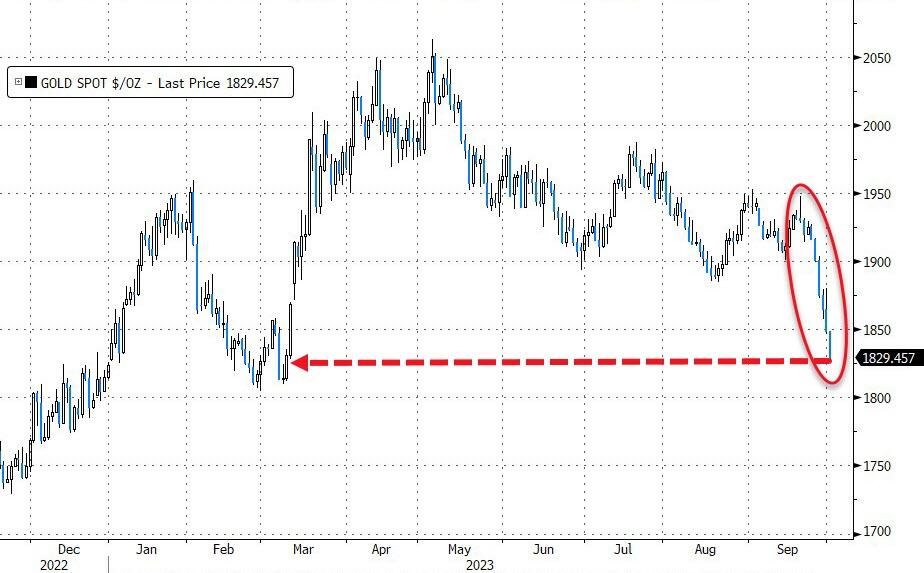
That tough talk boosted the dollar, which hurt oil and gold prices. Oil slipped below $90, while gold hit new lows. Gold bugs must be feeling very lonely right now.
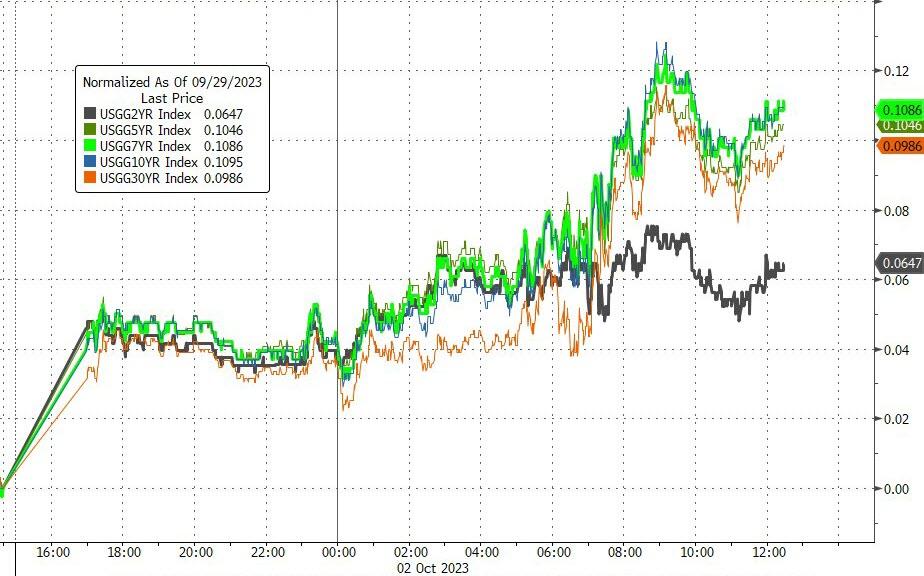
Bond yields jumped with the 10-year Treasury yield rising more than 10 basis points to 4.68% on Monday. Investors dumped Treasurys like hot potatoes after they heard that the government was not going to shut down. Apparently, they prefer risk over safety these days.
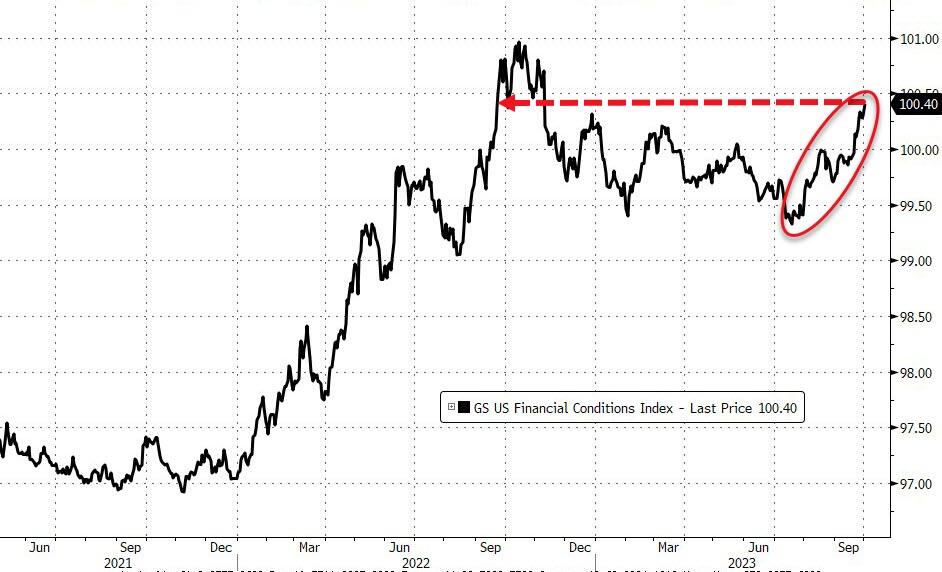
The most hated stocks got crushed, as the short squeeze from last Thursday ran out of steam and reversed. The shorts must be feeling very smug right now. Financial conditions are getting tighter, which means that stocks may have more downside ahead, according to ZeroHedge.
But who knows, maybe a big rally will come out of nowhere and change everything. Could that happen? Or are we doomed? You never know what will happen next in this crazy market.
Do you want to know which ETFs are hot and which ones are not? Then you need my High-Volume ETF Cutline report. It tells you how close or far each of the 311 ETFs I follow is from its long-term trend line (39-week SMA). These are the ETFs that trade more than $5 million a day, so they are not some obscure funds that nobody cares about.
The report is split into two parts: The winners that are above their trend line (%M/A), and the losers that are below it. The yellow line is the line of shame that separates them. You can see how many ETFs are in each group and how they have changed since the last report (88 vs. 70 current).

