
- Moving the market
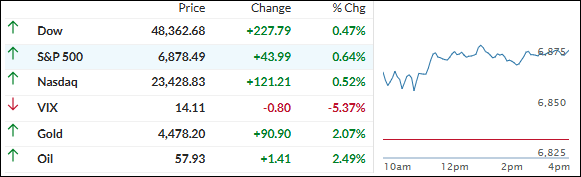
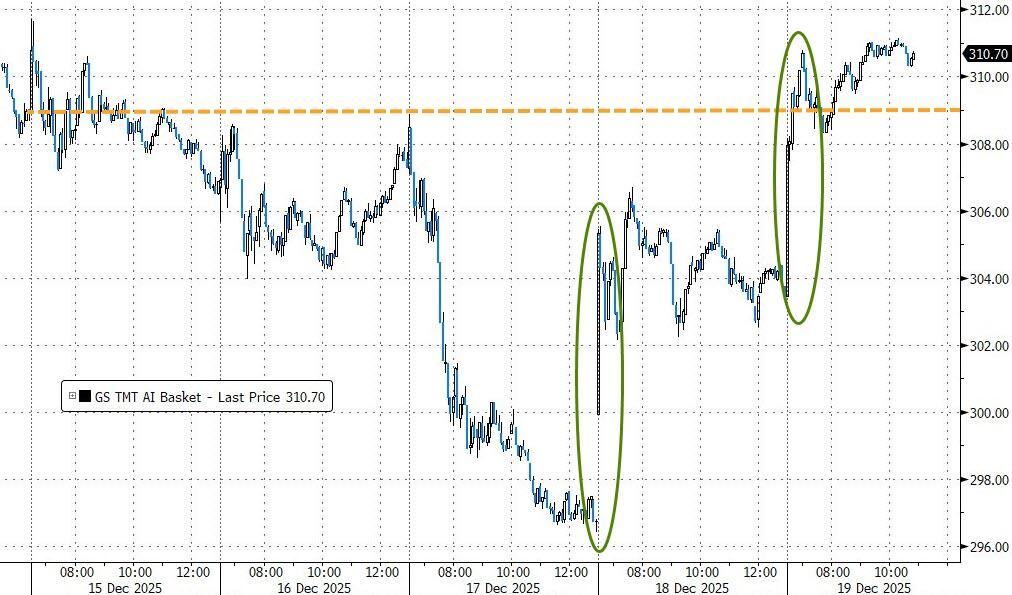
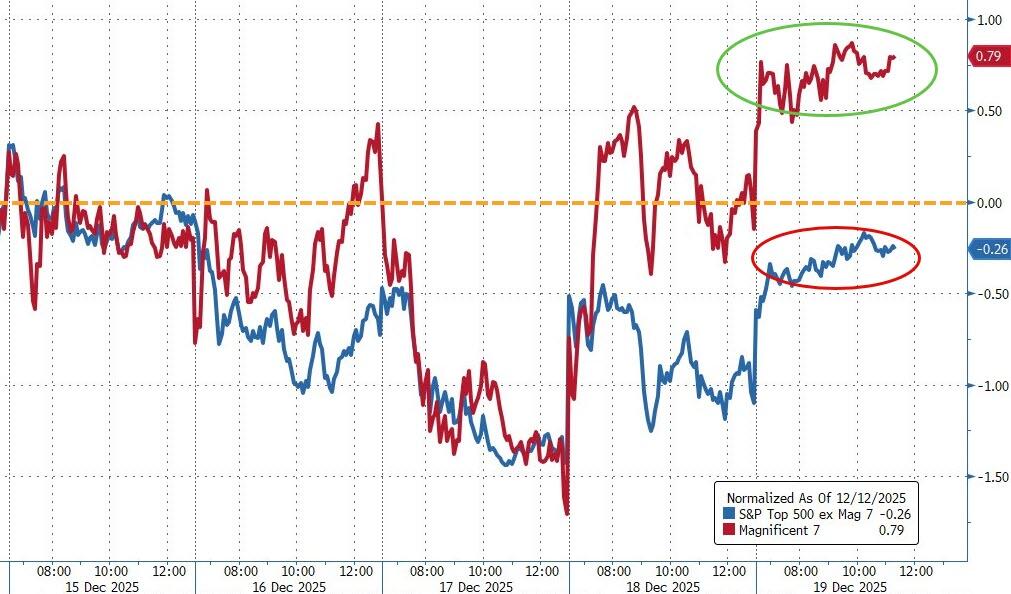
We started the day on a cheerful note, with the major indexes pushing higher right out of the gate—mostly thanks to tech and AI names getting their groove back.
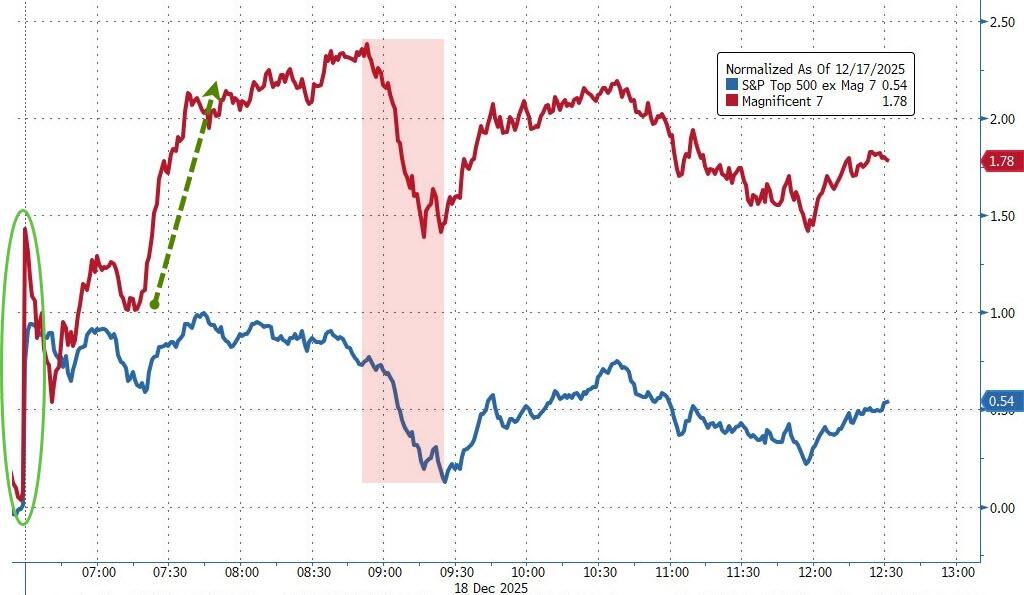
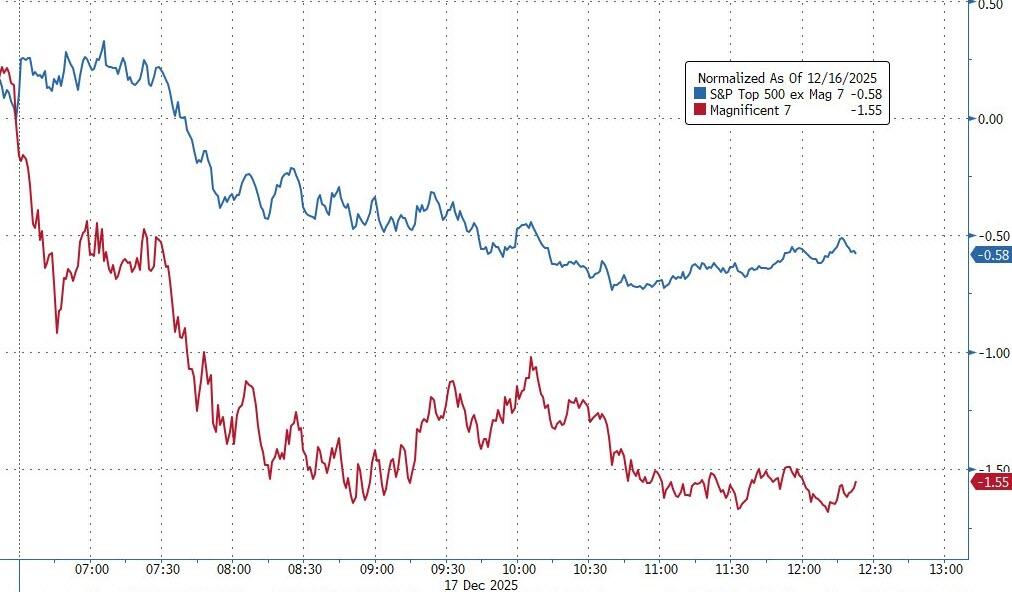
Nvidia climbed over 1% on news they’re eyeing mid-February shipments of H200 chips to China. Micron and Oracle each added about 2%, giving the whole AI crew a nice lift after last week’s solid rebound.
Investors are still rotating into cheaper corners of the market (value, cyclicals) amid all the “are tech valuations too crazy?” chatter, so everyone’s watching to see if AI can hang onto leadership into year-end.
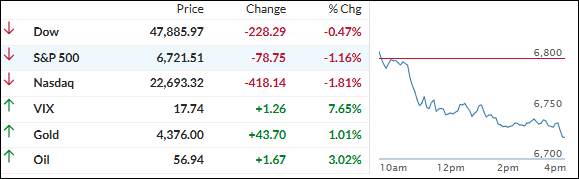
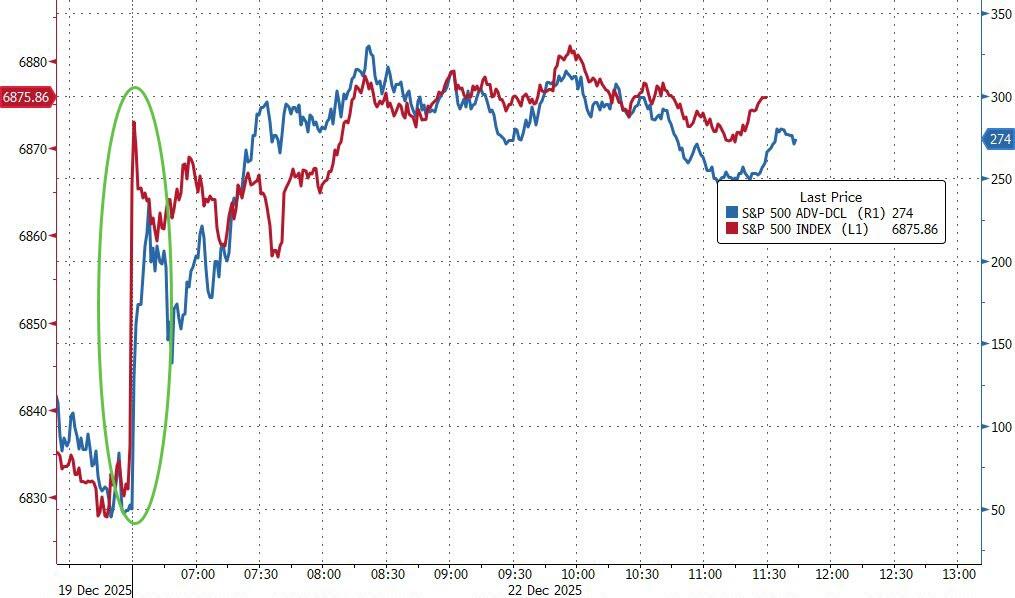
There’s been some doubt about a real Santa Claus rally kicking in—the S&P’s been flirting with a key technical level—but today eased a lot of those worries. Breadth was strong, and pretty much every asset class got in on the fun.
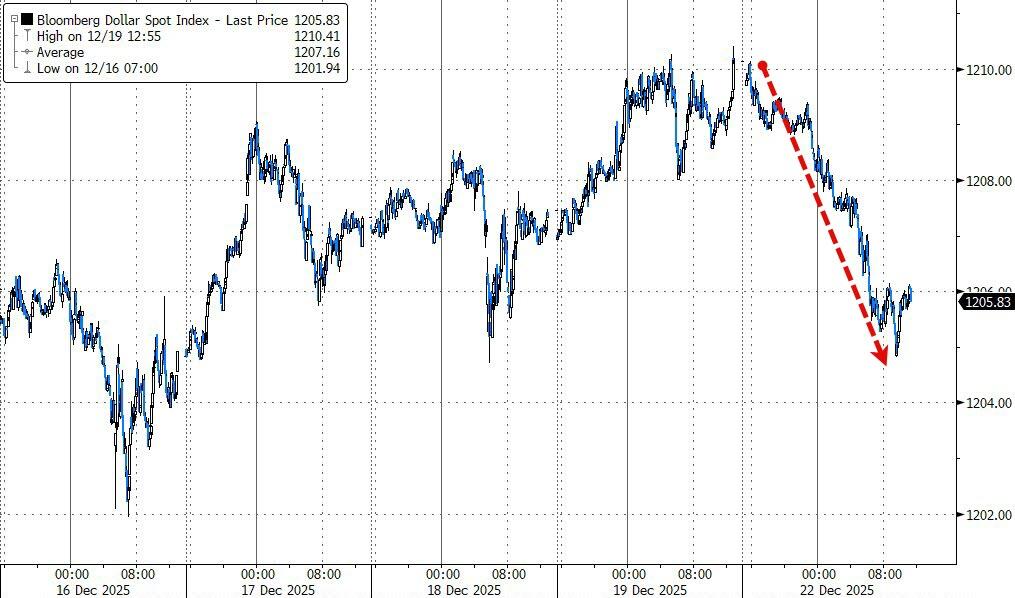
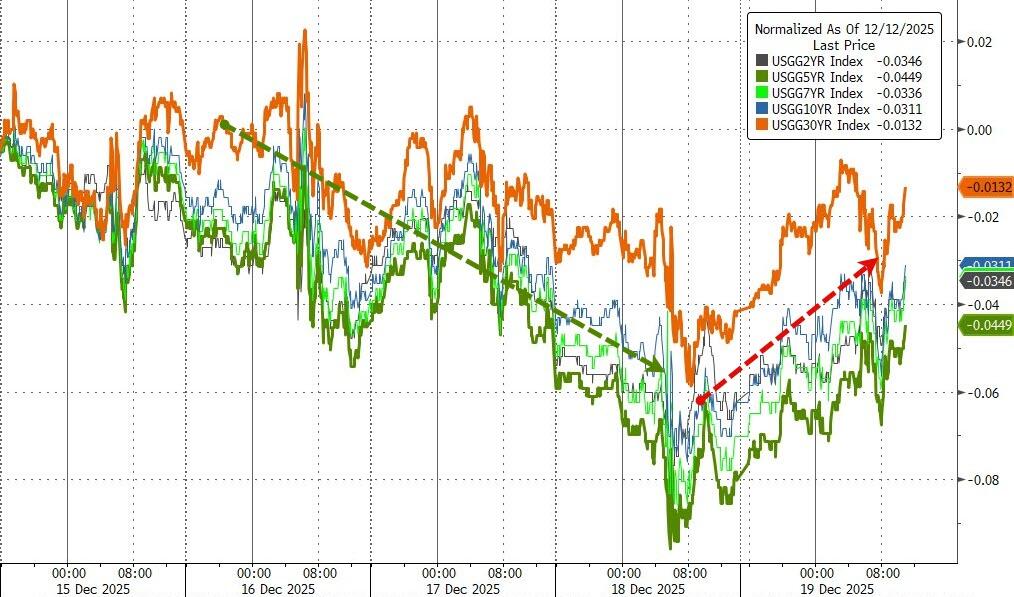
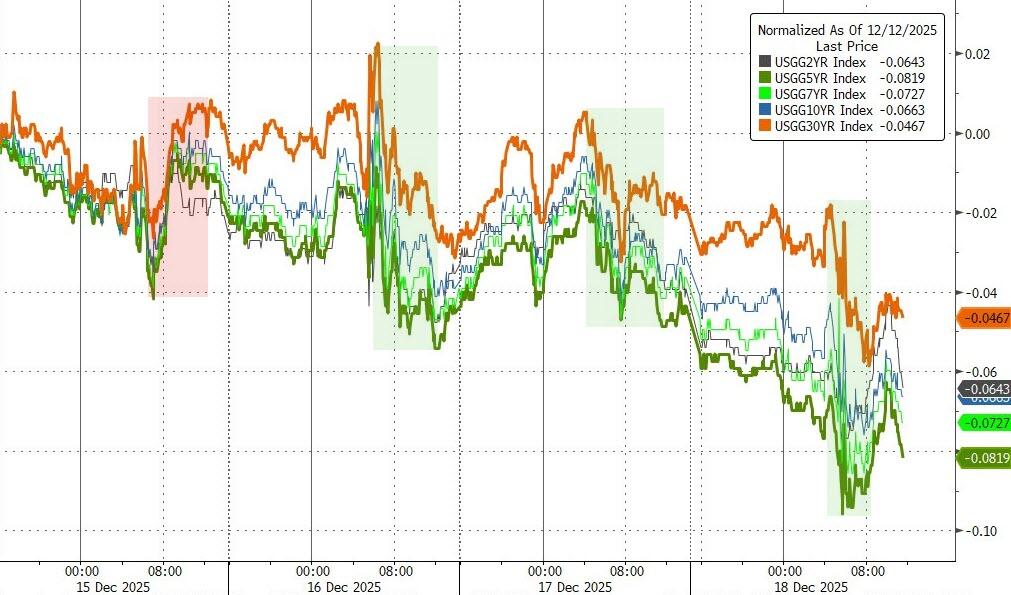
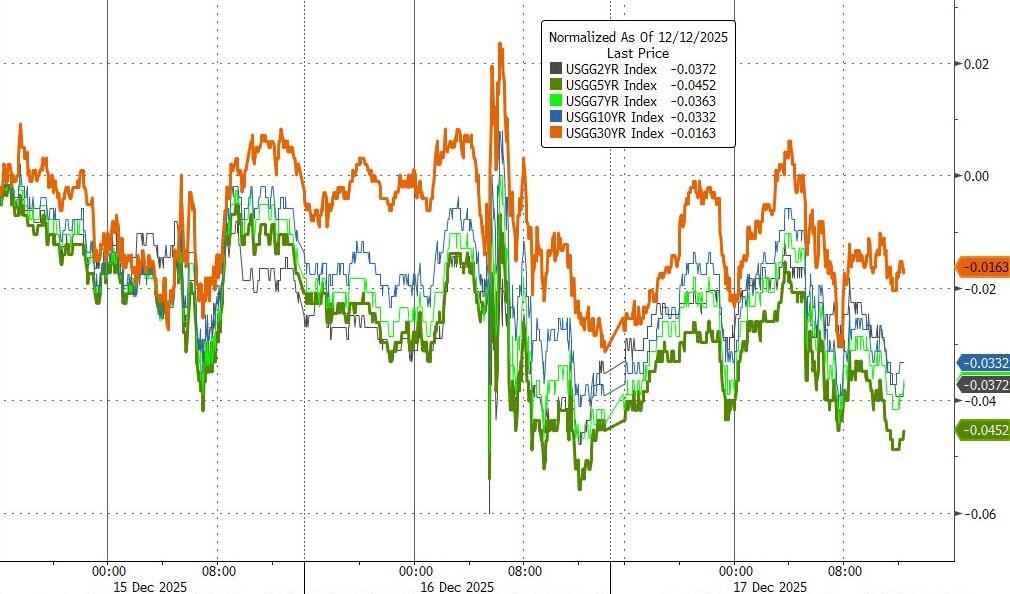
Even rising bond yields couldn’t spoil the mood (though they did knock the dollar lower all session).
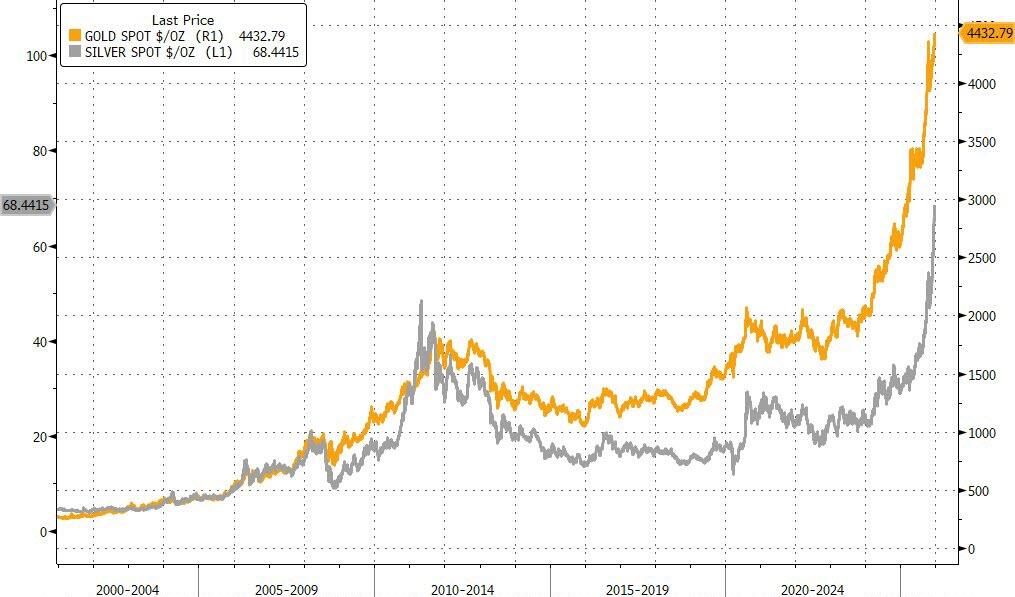
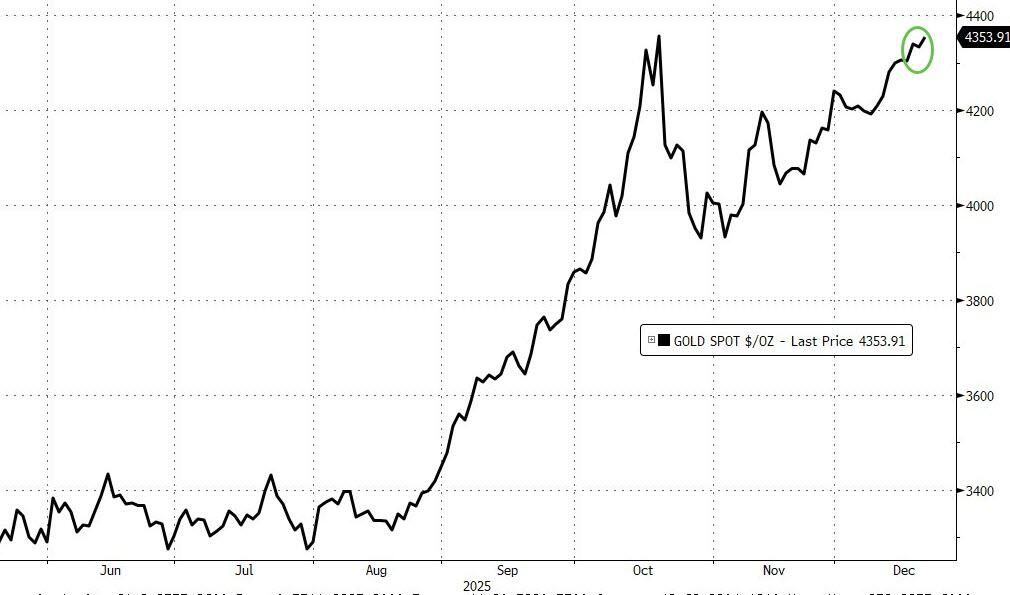
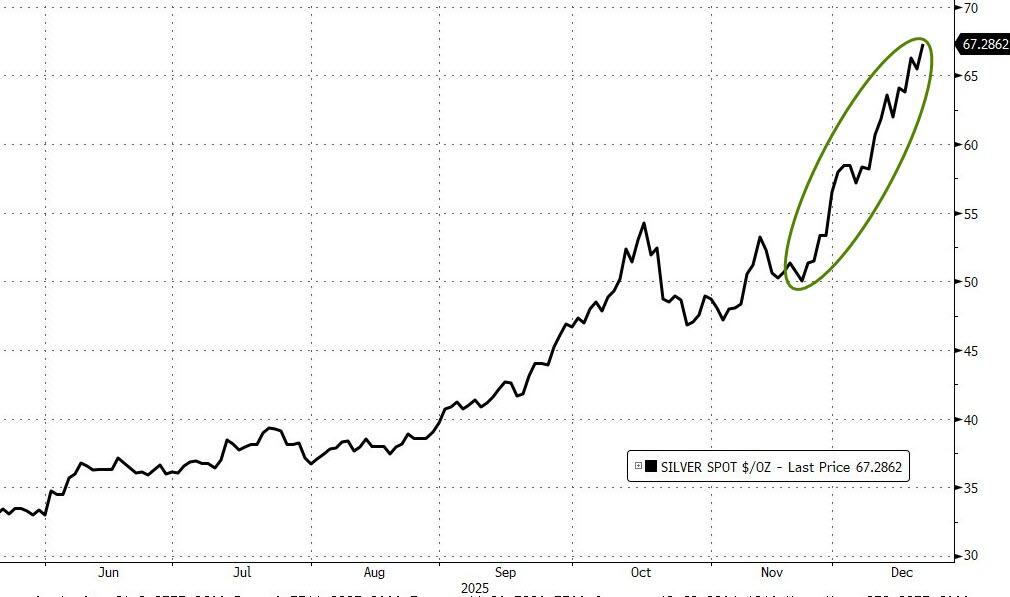
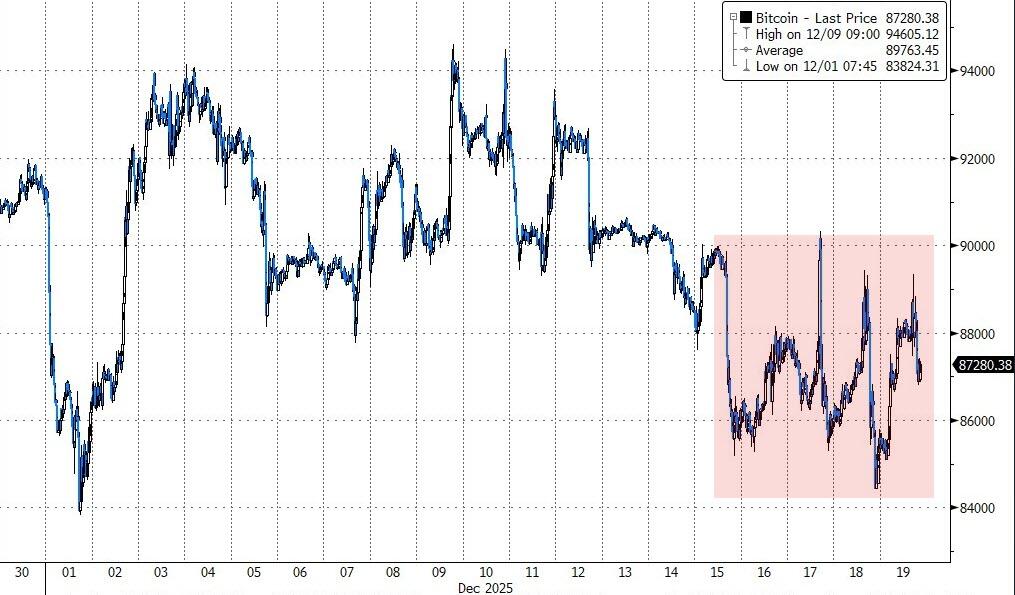
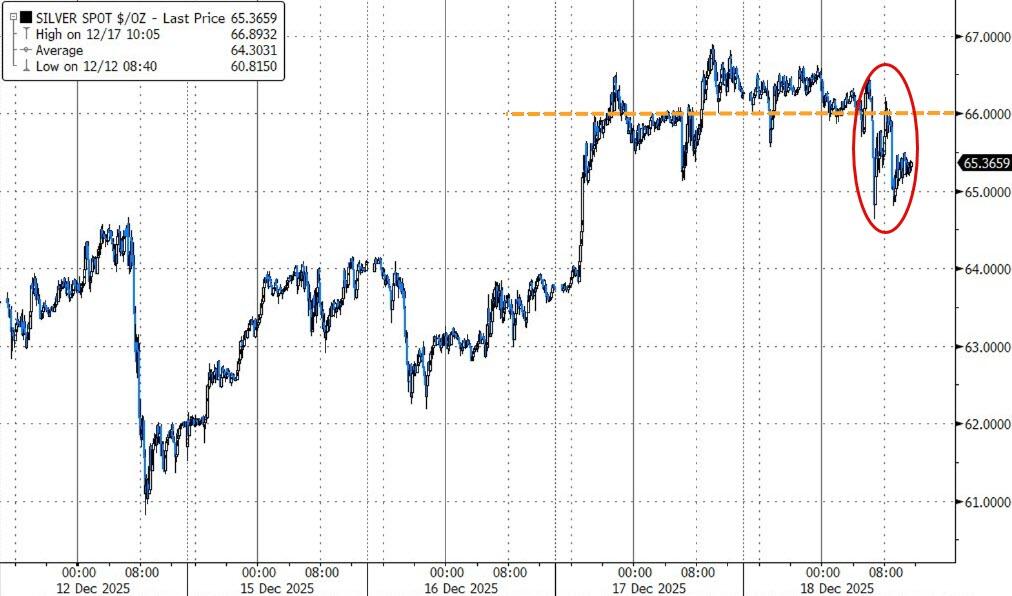
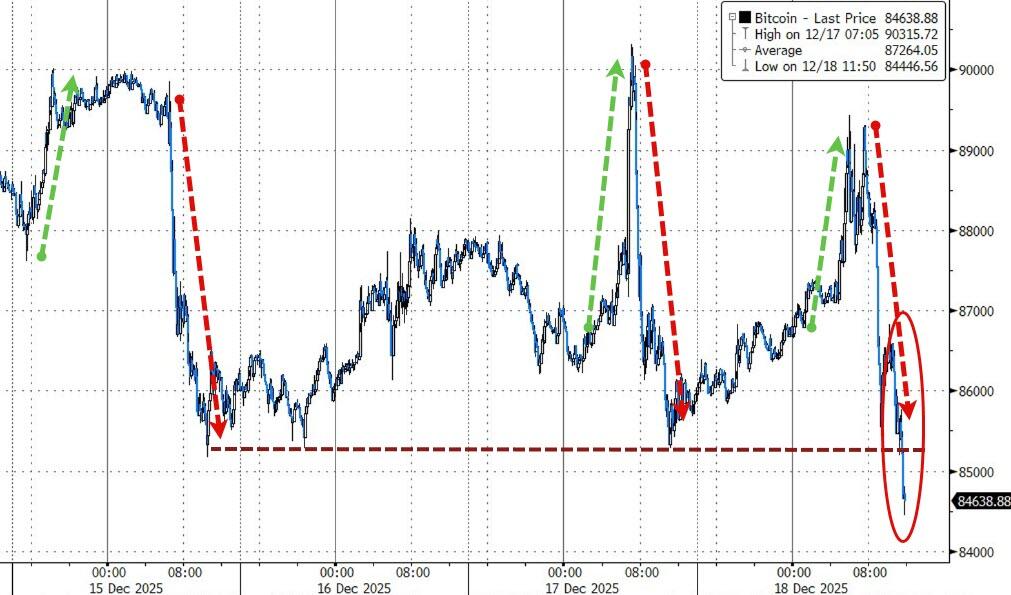
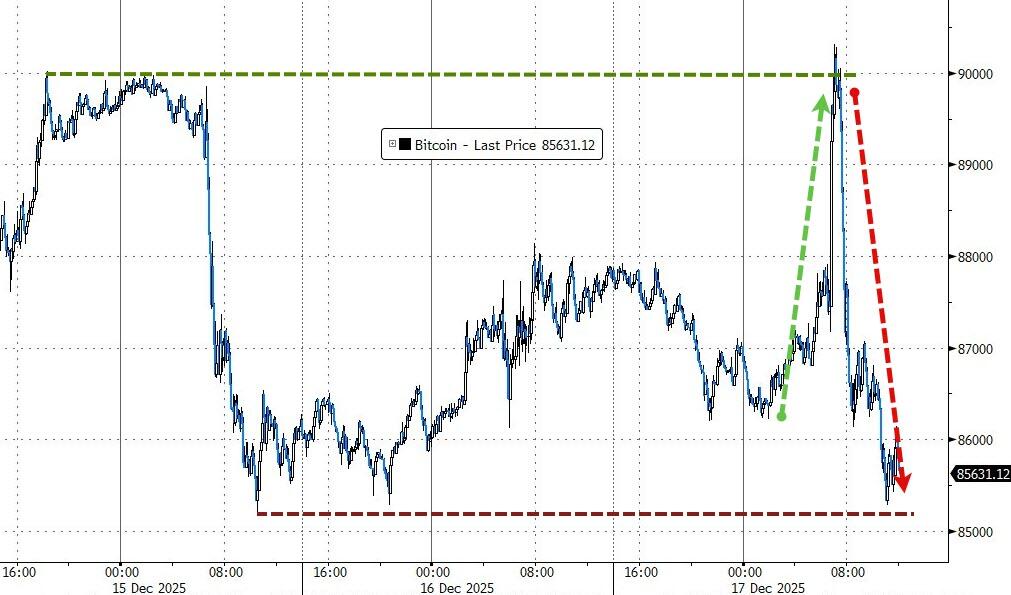
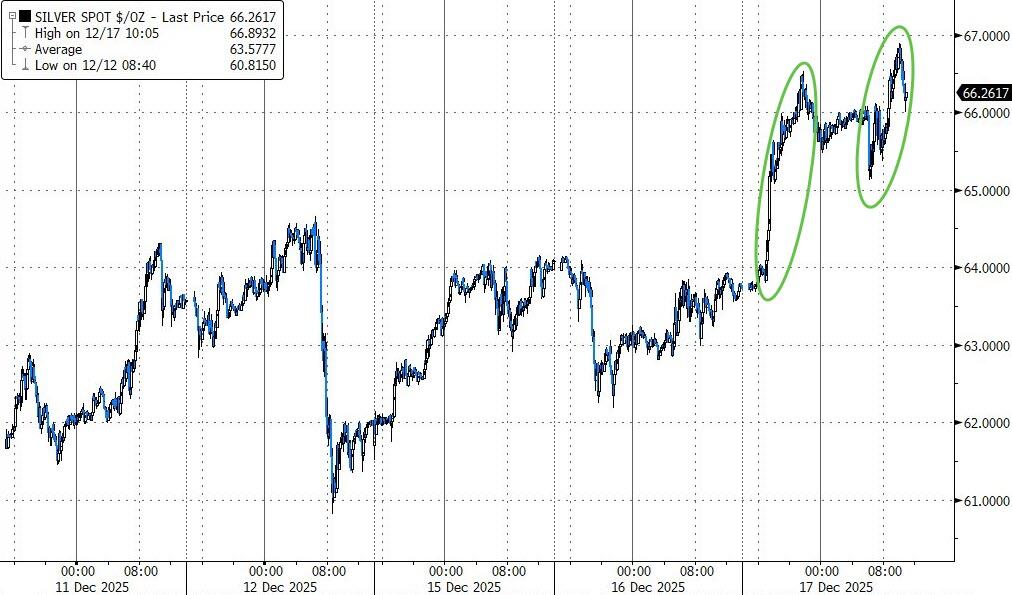
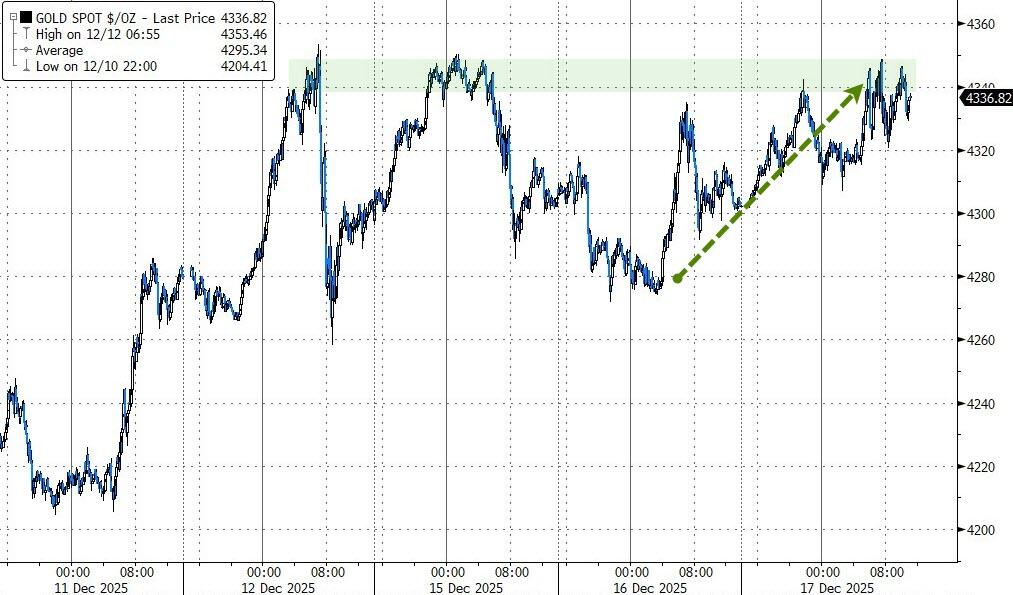
That weakness was rocket fuel for precious metals: gold and silver both blasted to new record highs. Bitcoin started strong but gave it all back late and closed flat.
Quick question for you: when stocks grind higher, but metals are the ones smashing all-time highs, does it feel like pure risk-on harmony across the board… or a subtle sign some folks are quietly hedging just in case?
Read More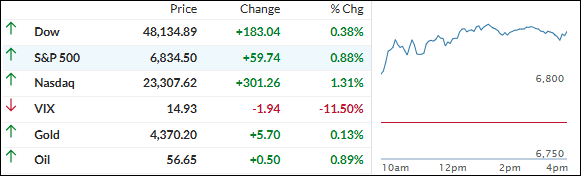

